Figure 1:
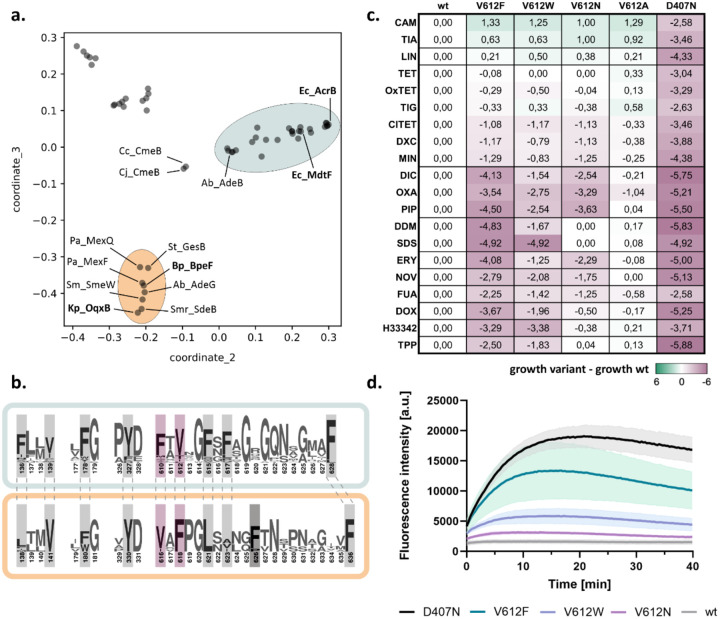
A conserved DBP residue alters the resistance phenotype conferred by E. coli AcrB. a. Map of pairwise sequence similarities between representative RND proteins (table S1) was generated with the multidimensional scaling pipeline PaSiMap32. The coordinates for the two highest dimensions (coordinate_2 and coordinate_3) are displayed in the plot. The AcrB and OqxB clusters are highlighted in cyan and orange, respectively. Abbreviations are given in figure S2. b. Consensus sequence of the AcrB (cyan) and OqxB (orange) clusters. Residues that are part of the DBP are highlighted. Residue numbers correspond to the sequence of AcrB or OqxB, respectively. F617 of the AcrB cluster is poorly conserved in the OqxB cluster. This is likely compensated by F626 (darker grey) that adopts similar position in the OqxB structure (see Fig. 2a). F610 and V612 (purple) of the AcrB cluster have exchanged positions in the OqxB cluster. c. Phenotype characterisation of AcrB V612 variants by plate dilution assays. A serial dilution of the bacterial culture was applied on plates containing different toxic substrates. The last dilution step for which growth was detected was determined and normalised to the wildtype (wt). The inactive D407N was used as a negative control. Green: increased growth, purple: decreased growth; abbreviation as in table S2. The figure shows average data of three biological replicates. The original images of the plate dilution assays are available under source data. d. Berberine accumulation in E. coli cells expressing different AcrB V612 variants. AcrB activity was monitored by measurement of the berberine fluorescence. AcrB wildtype (wt) and the inactive D407N were used as controls. Data present the mean values (solid line) with standard deviation (shaded background) of three biological replicates.

