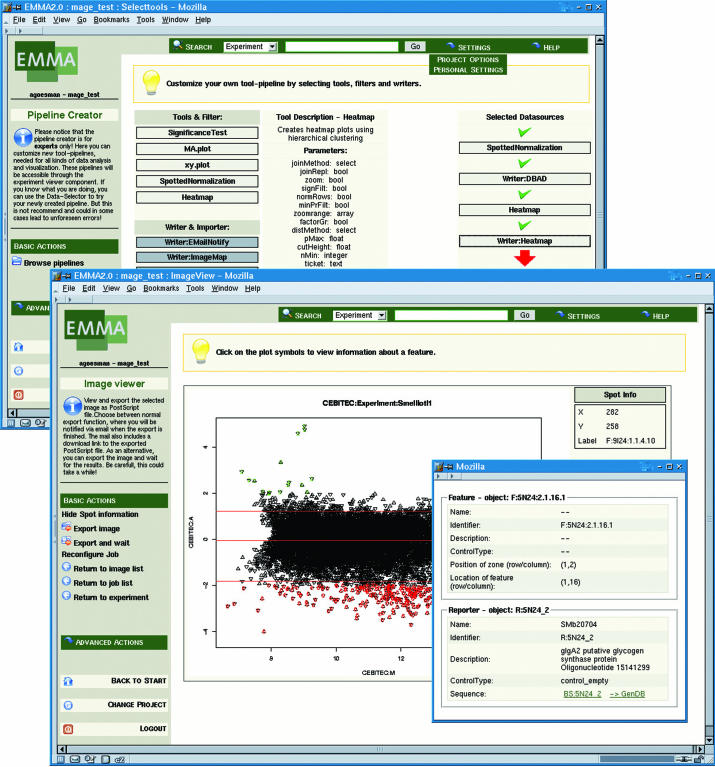
Figure 2.
Two examples of the user interface of the EMMA software. The up-most window displays the tool configuration wizard, which serves to define customized analysis pipelines. The building blocks of pipelines are functions or external programs known as plug-ins. The second screenshot depicts a scatterplot of the normalized log-expression versus the log-intensity where each gene is linked to its corresponding annotation.

