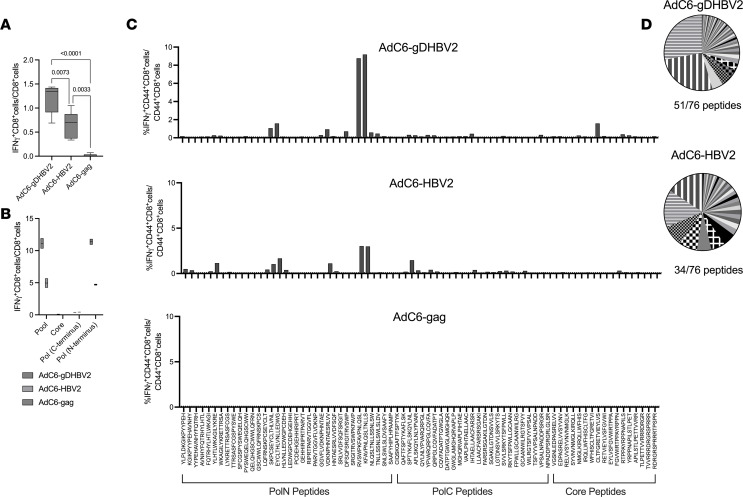
Figure 2. Effects of gD on vaccine immunogenicity.
Mice were immunized with 1 × 10¹⁰ vp of AdC6 vectors expressing gDHBV2, HBV2, or gag of HIV-1. (A) PBMCs from 5 individual mice were tested 4 weeks later for responses to the HBV peptide pool. P values for differences between groups calculated by 2-way ANOVA are shown above the lines. (B) Duplicate samples of pooled splenocytes from 5 mice/group were tested 8 weeks after immunization for CD8+ T cell responses to peptides representing the HBV2 (pool), or N- and C-terminal sequences of Pol or core. (C) Splenocytes harvested 8 weeks after vaccination were tested for CD44+CD8+ T cell responses to individual peptides of the HBV2 sequence. (D) The pie charts show relative responses to individual peptides. Peptides that are strongly recognized by T cells from mice immunized with the AdC6-HBV2 or AdC6-gDHBV2 vaccine are highlighted by fill patterns.

