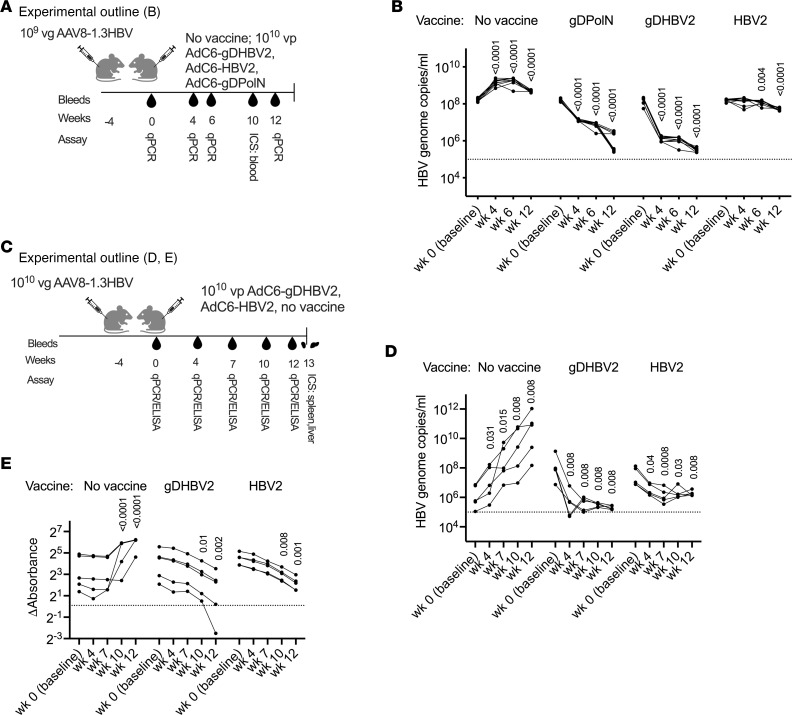
Figure 3. Vaccine efficacy in mice infected for 4 weeks with AAV8-1.3HBV.
(A) Experimental outline for graphs in B and Figure 4, A and B for 10 mice that were injected with 1 × 10⁹ vg of AAV8-1.3HBV. (B) HBV genome copy levels in serum over time. Significant differences comparing baseline to after-vaccination data were calculated by multiple unpaired Mann-Whitney test and levels of significance are displayed within the graph. The dotted line at 105 indicates the detection limit. (C) Experimental outline for graphs D and E and Figure 4, C–G for 5 mice that were injected with 1 × 10¹⁰ vg of AAV8-1.3HBV. (D) HBV genome copy levels in serum over time. Significant differences comparing baseline to after-vaccination data were calculated by multiple unpaired Mann-Whitney test and levels of significance are displayed on top of each group. The dotted line at 105 indicates the detection limit. (E) ELISA data for HBsAg in sera are shown as absorbance values from which background data had been subtracted. The dotted line shows results for the negative control (serum from naive mice). Significant differences versus baseline were determined by 2-way ANOVA and P values are displayed within the graph.

