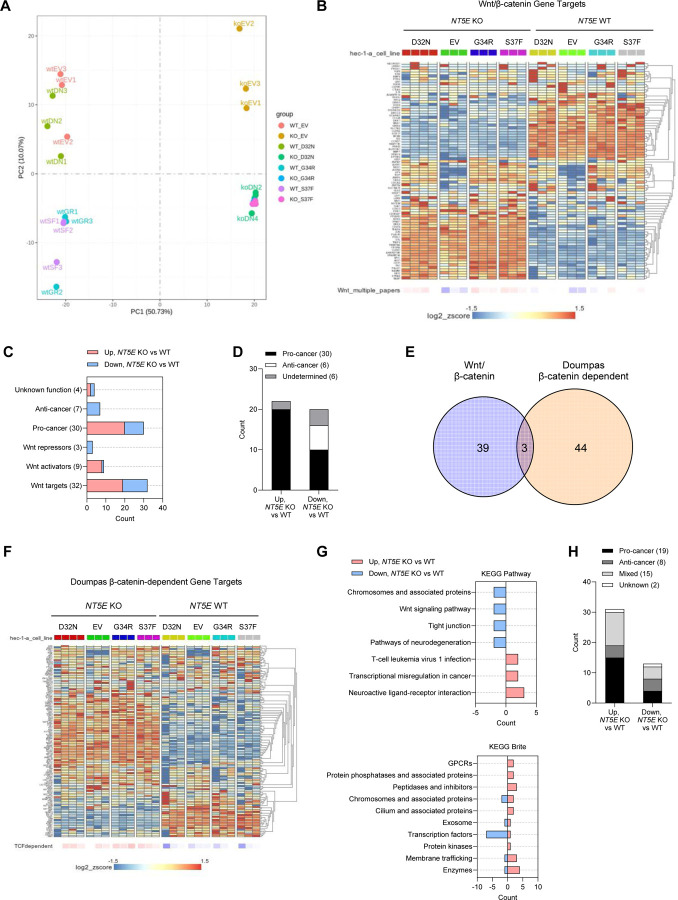
Figure 6. Loss of CD73 results in an oncogenic WNT/β-catenin gene signature.
(A) PCA plot for RNA-seq data from NT5E WT vs. NT5E KO HEC-1-A cells expressing empty vector (EV) or different β-catenin mutants. (B-D) RNA-seq data analyses using literature-derived Wnt/β-catenin signaling target genes. (B) Heatmap showing global differences in Wnt/β-catenin signaling target genes between NT5E WT vs. NT5E KO. (C) Analysis of genes from (B) that were significantly different between NT5E KO EV vs. NT5E WT EV. Genes were placed in categories based on Wnt function and literature-reported oncogenic (pro-tumor) or tumor suppressor (anti-cancer) activity. Total number of genes in each category is indicated in parentheses. (D) Combined pro-cancer and anti-cancer-associated genes by upregulation or downregulation status in NT5E KO EV vs. NT5E WT EV samples. (E) Venn diagram of Wnt/β-catenin signaling target genes and Doumpas Wnt/β-catenin-dependent target genes, significantly disregulated between NT5E WT vs NT5E KO cells. (F-H) RNA-seq data analyses using Doumpas Wnt/β-catenin-dependent target genes. (F) Heatmap showing global differences in Doumpas Wnt/β-catenin-dependent target genes between NT5E WT vs. NT5E KO. (G) KEGG pathway and Brite analyses of genes significantly altered in (F) in NT5E KO EV vs. NT5E WT EV samples123. (H) Combined pro-cancer and anti-cancer-associated genes significantly altered in NT5E KO EV vs. NT5E WT EV samples.

