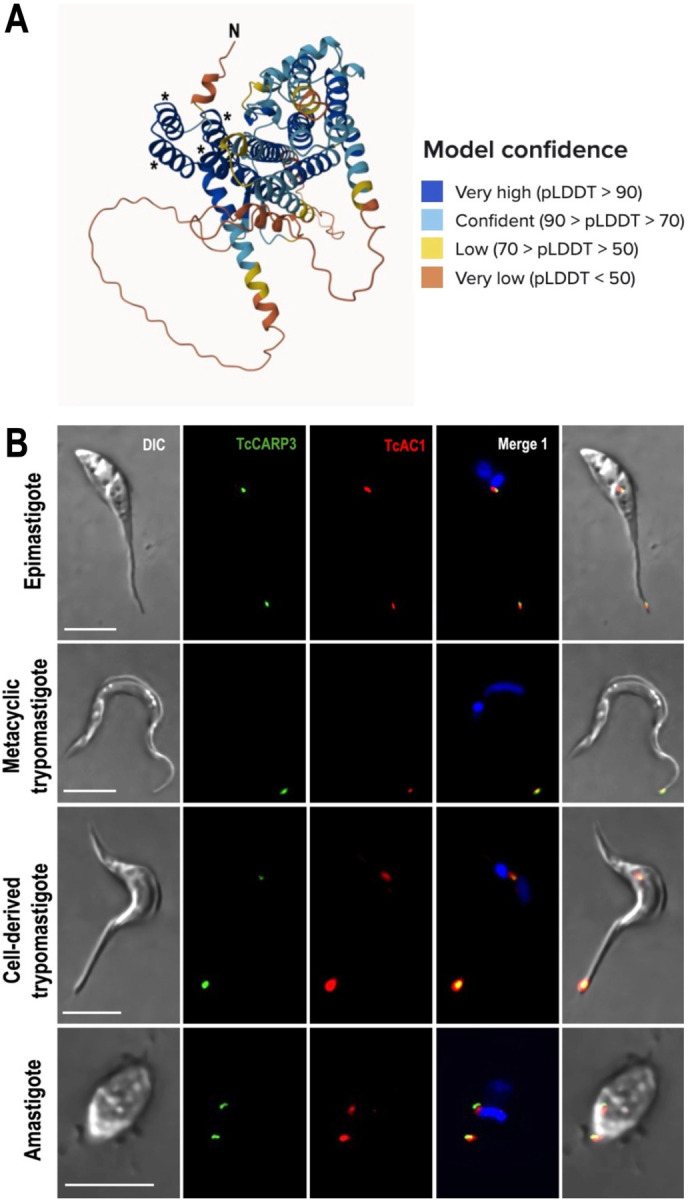
Figure 1. TcCARP3 predicted structure and co-localization of TcCARP3 and TcAC1 in different developmental stages of T. cruzi.

[A] TcCARP3 structure predicted with AlphaFold. Model confidence using per-residue confidence score (pLDDT) is indicated by color-code. Regions below 50 pLDDT may be unstructured in isolation. Asterisks indicate the four alpha helices predicted to constitute the Tetratricopeptide-like helical domain at the N-terminus of TcCARP3. [B] IFAs were performed using TcAC1-3xHA/TcCARP3-3xc-Myc dually tagged cell line under hypoosmotic stress. Images from left to right show DIC, TcCARP3 (green), TcAC1 (red), TcCARP3 and TcAC1 merged (yellow) with DAPI (blue), and with DIC. DAPI was used to stain the nucleus and kinetoplast. Scale bars: 5 μm.
