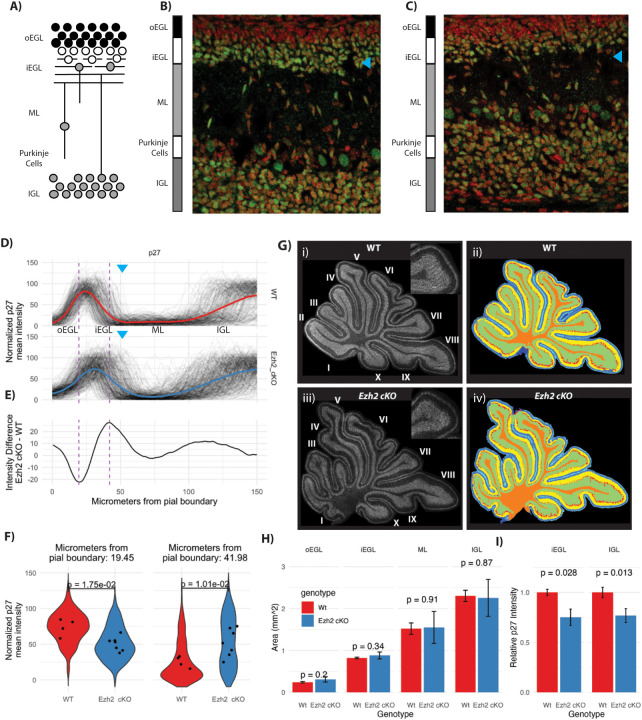
Figure 3: Ezh2 cKO leads to a depletion of the inner EGL.
A) Schematic of granule neuron (GN) development in a P7 cerebellum sagittal slice. Inner external grandule layer (iEGL), outer external granule layer (oEGL); molecular layer (ML), internal granule layer (IGL). B) WT and C) Ezh2 cKO 40× confocal micrographs of the deep sulcus between lobule V and VI in the control and in the cKO, showing DAPI (red) and p27 (green; a cell cycle arrest marker in GNPs). In the mutant, the boundary between the inner EGL and the ML and the ML with the IGL is ill-defined. The cyan arrow indicates the position of the inner EGL, there are fewer p27 labeled cells sitting within the EGL. The cellular density is reduced in both the inner EGL and IGL. D) Quantification of the boundaries adjacent to the ML in WT and Ezh2 cKO by collapsing 2D images into 1D line segments. The line segments for anti-p27 immunofluorescence span from the pial boundary to the IGL and show a hump of high average fluorescence at the inner EGL and the IGL. In the Ezh2 cKO the iEGL p27 signal extends further into the ML then in the WT. The blue arrows show the approximate position of the transition between the iEGL and the ML. E) The average fluorescence intensity difference between mutant (n = 7) and WT (n = 4) shows where along the line segment from the pia to the IGL is the Ezh2 cKO most different from the WT. Positive values are associated with p27 value being higher in the Ezh2 cKO and is highest at the boundary of the inner EGL and the ML and to a lesser extent at the boundary between the ML and IGL. The WT shows higher signal within the inner EGL itself where the values of E are negative. F) Quantification of each line segment at the point where the differences between Ezh2 cKO and WT are largest as indicated by the hashed lines seen in panel D and E. The left panel shows quantification at position where the WT had had more P27 staining then to the Ezh2 cKO and the right panel shows the opposite. The distribution of the values at the 2 positions in right and left panel for the 266 WT and 315 Ezh2 cKO line segments was shown as a violin plot (a histogram that is mirrored). The dots correspond to individual mice, with multiple slides analyzed for each mouse. P-values are calculated using a T-test showing a significant increase of P27 labeling within the boundary of the EGL and ML. G) Segmentation into inner and outer EGL, ML, IGL and deep white matter using panoramic images of the entire cerebellum, labeled with DAPI, P27, NeuN. Anti-p27 over the entire P7 cerebellar section, for WT i) and Ezh2 cKO ii). H) Quantification of the area for each layer in WT and Ezh2 cKO shows no significant difference, indicating the overall structure of the cerebellum is not dramatically altered and the phenotype is limited to the early migration out of the inner EGL. I) Quantification of the anti-p27 fluorescence intensity by layer shows a decrease in the fluorescence in Ezh2 cKO versus WT, for the inner EGL (p-value 0.028, t-test) and IGL (p-value 0.013, t-test). The decrease in p27 abundance suggests that the total number of neurons within the inner EGL and the IGL density of cells within those areas is reduced.

