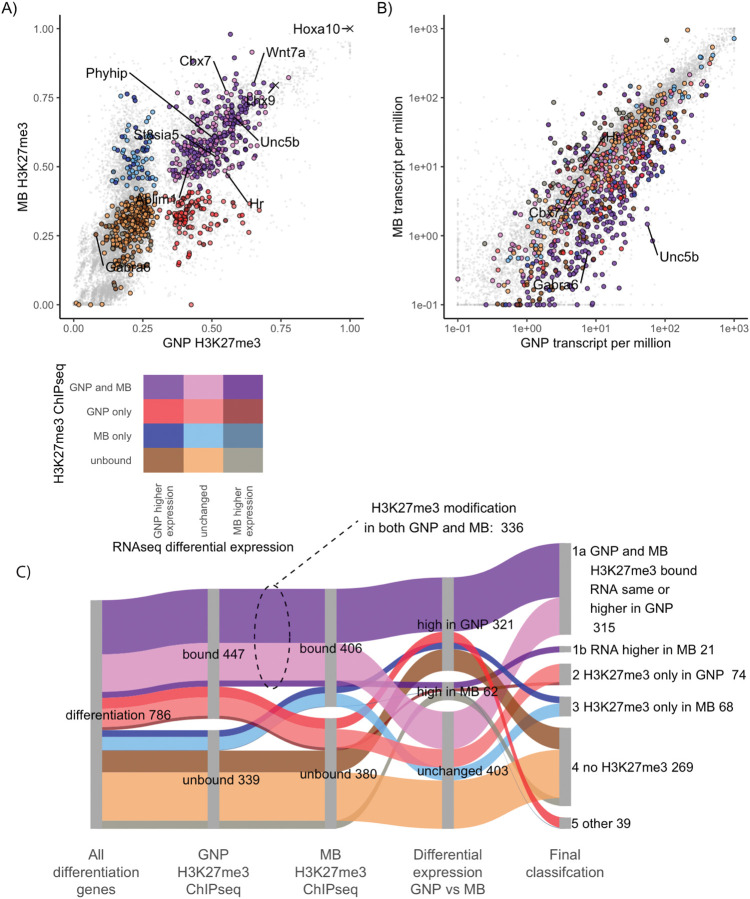
Figure 6: In medulloblastoma cells GNP differentiation genes are transcriptionally repressed and H3K27me3 modified.
A) H3K27me3 quantified over the promoters of GNP differentiation genes in GNPs (x-axis) and MB (y-axis). Genes are color-coded based upon H3K27me3-marked versus not marked in GNP and MB. Genes whose promoters show more H3K27me3 modification in GNP are shown in red, while those higher in MB are blue and those modified in both are purple. Duller colors (dark tones) were used if higher relative expression in MB than in GNPs. Higher saturation colors indicate gene expressed relatively higher in GNPs than in MB. The colour legend is seen bellow panel A. B) Transcript levels of differentiation genes in P7 GNPs, x-axis) versus in Ptch1+/− derived MB cells (y-axis). Colors are inherited from panel A with dark tones used for genes in MB (2 fold higher expression and adjusted p-value <0.05) and high saturation colours when higher expression in GNPs. C) Sankey diagram showing how the H3K27me3 modified differentiation genes are expressed in MB. The second column shows the differentiation genes in GNP separated by H3K27me3 modification. The third column compares MB H3K27me3 ChIP, showing of 447 H3K27me3 modified GNP differentiation genes, 336 (75%) of those genes are also H3K27me3 modified in MB. The fourth column shows differential expression between P7 GNPs and MB. Even when the H3K27me3 is not present in MB cells only 8% of the differentiation genes show an increase in expression in MB compared to P7 GNPs. The fifth column shows the final classification.

