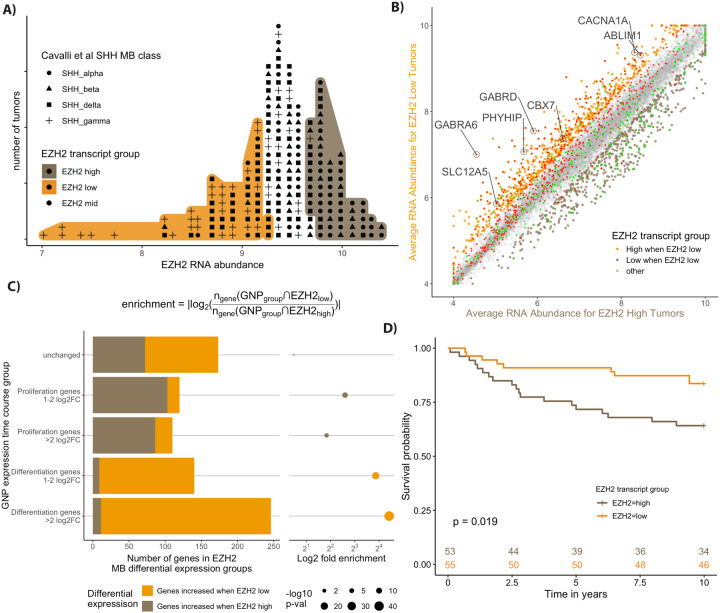
Figure 7: Human SHH MBs with High EZH2 are associated with worse outcome and show lower expression of GNP differentiation genes.
A) Labeled dot histogram of EZH2 transcript abundance from 223 human SHH MB with the top (orange) and bottom (brown) 30% labeled. Each human tumor is represented as a dot with the symbols reflecting the most recent SHH MB classification (9). Note the high number of patients with gamma-class SHH MB with low EZH2 expression. These patients are infants with a typically good prognosis. B) Comparison of average gene expression between the human MB samples from the 30% highest (x-axis) and lowest EZH2 (y-axis) expressing tumours. The color labels show more highly expressed genes that are 1.5 fold higher (adjusted p < 0.05) in tumours that were low in EZH2 were labelled orange, while those that are higher in EZH2 high tumours are brown. The GNP differentiation genes (red) show considerable overlap with the genes highest in EZH2 low tumours (orange), while the GNP proliferation genes (green) show overlap with the genes that are highest in EZH2 high tumours (brown). C) Quantification of the extensive overlap between GNP differentiation genes and genes highly expressed in EZH2 low human MB tumours. The categories of genes based on the GNP time course (y-axis) are quantified using a bar graph that shows the intersection of genes for each GNP group to either genes that are highly expressed when Ezh2 is low (EZH2low) or genes that are highly expressed when Ezh2 is high (EZH2high). Enrichment is calculated as the number of GNP group genes that intersect (◠) with EZH2low genes over the number that intersect with EZH2high genes as described in the equation. The p-value is determined by the hypergeometric test. D) Kaplan-Meyer curves show a significant 10 year survival difference for SHH MB patients with high versus low EZH2 transcript.

