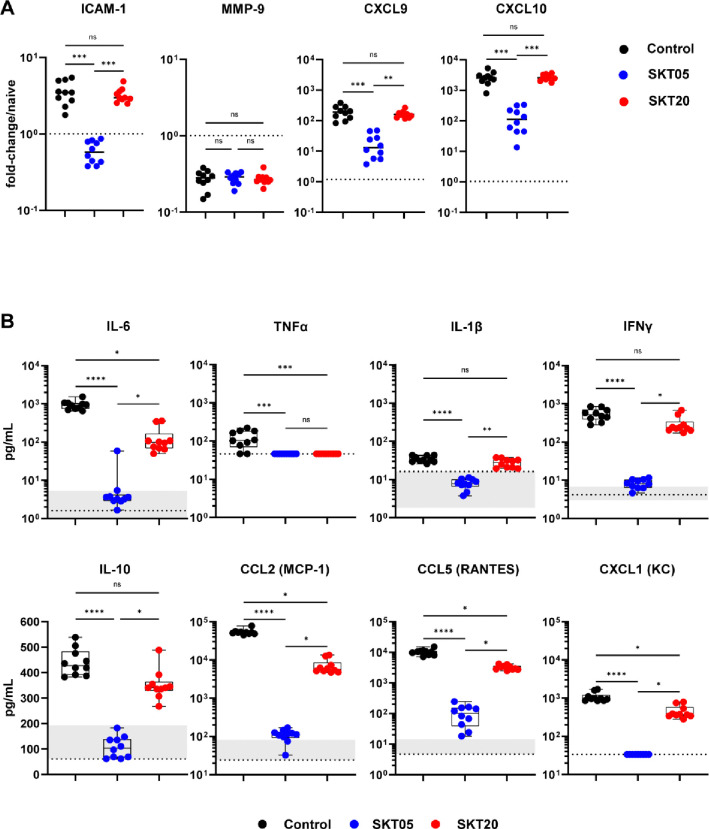
Figure 2. SKT05 and SKT20 reduce pro-inflammatory cytokines and chemokines during VEEV infection.
C3H/HeN were administered 200 μg of indicated mAb at 1 day before infection with TC-83. (A) Brains were harvested at 5 dpi for gene-expression analysis by RT-qPCR (n = 10/group; 2 independent experiments). Samples were normalized to Gapdh and then compared to naïve tissue. Fold-change was calculated using 2−ΔΔCt. The dotted line represents the average fold-change in naïve mouse controls (n = 5). Bars represent the median. (B) Brains were harvested at 6 dpi and the concentration of cytokines and chemokines were determined using a Bio-plex assay. The box and whisker indicate the min to max (n = 10/group; 2 independent experiments). The min and max concentration of the analyte detected in the naïve brain homogenate is represented by the shaded regions within the graphs. The dotted line represents the LOD of the assay. If naïve samples were at the LOD, only a dotted line is shown. (A-B) Statistical significance was determined by Kruskal-Wallis with a Dunn’s post-test comparing all groups.

