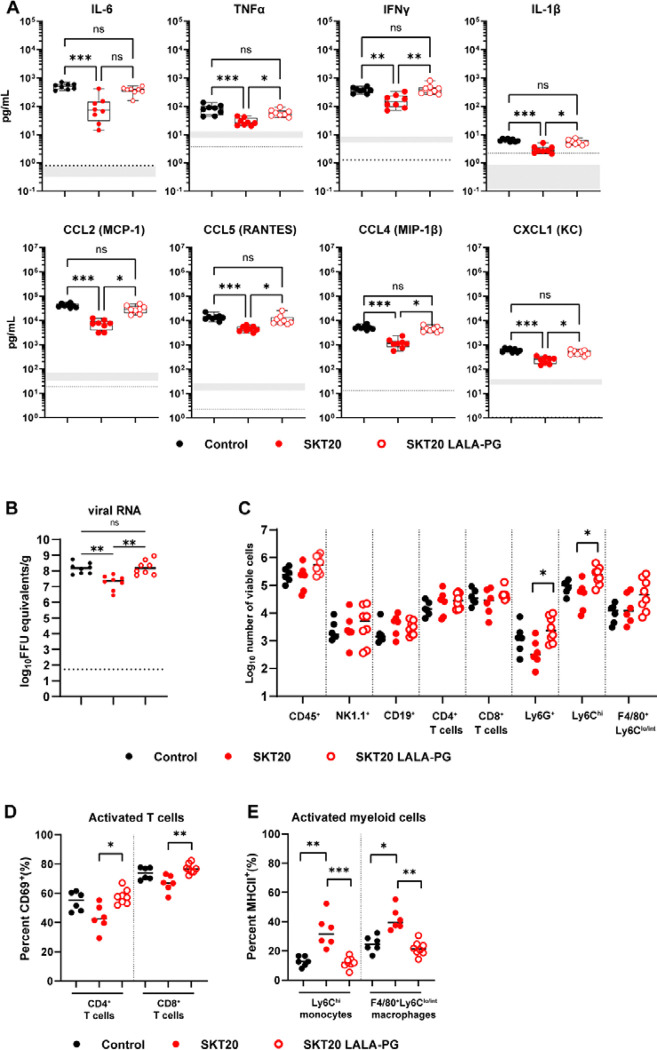
Figure 4. SKT20 alters the pro-inflammatory response and immune cell infiltrates in the brain through Fc effector functions.
C3H/HeN mice were administered an isotype control, SKT20, or SKT20 LALA-PG (200 μg) at 1 day prior to infection with TC-83. (A-B) At 6 dpi, brains were harvested. (A) Chemokine and cytokine concentrations were determined using a Bio-plex assay. The box and whisker plot indicates the min to max (n=10/group, 2 independent experiments). The shaded bar represents the min and max concentration for naïve animals. The dotted line represents the LOD of the assay. If naïve samples were at the LOD, only a dotted line is shown. (B) Viral RNA in brain homogenate was determined by RT-qPCR (n = 6–8/group; 2 independent experiments). (C-E) At 6 dpi, brains were collected and digested. (C) Single cell suspensions were stained, and flow cytometry was performed to assess the total number of indicated cells. The percentage of activated (CD69+) CD4+ and CD8+ T cells (D) and activated (MHCII+) monocytes and macrophages (E) was determined by flow cytometry. (B-E) Bars represent the median. For all graphs, statistical significance was determined by Kruskal-Wallis with a Dunn’s post-test comparing all groups.

