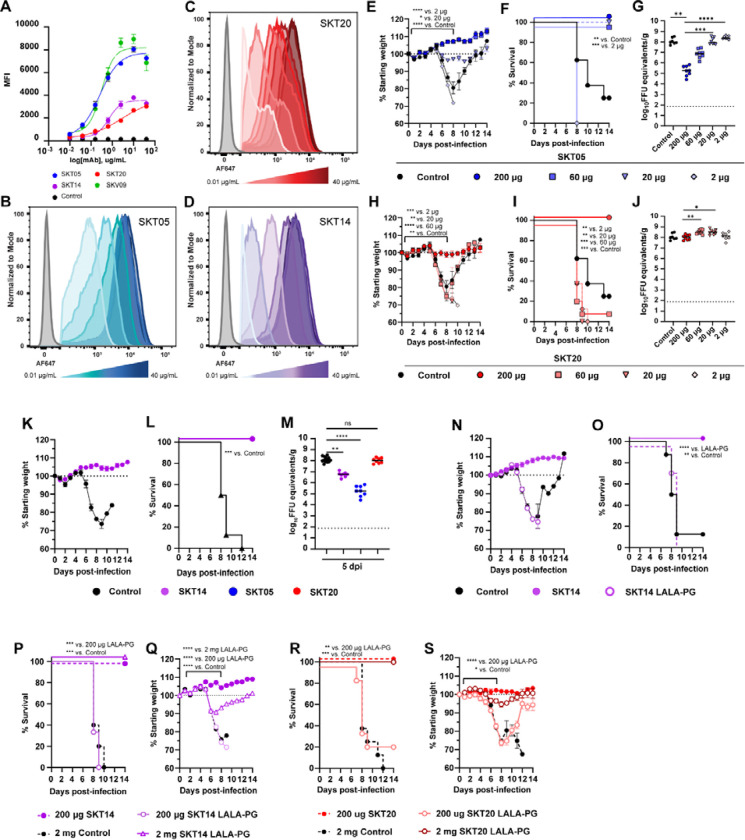
Figure 6. Fc effector function necessity is dependent on functional avidity rather than epitope specificity.
(A-D) Binding of indicated mAbs to the surface of live Vero cells infected with TC-83 was determined by flow-cytometry. EC50 values were determined by nonlinear regression of log transformed data. Data shows the median of 2 independent experiments performed in duplicate. (B-D) Histograms show binding of dilutions of SKT05 (B), SKT20 (C), and SKT14 (D) to the surface of live, TC-83 infected Vero cells. (E-J) C3H/HeN mice were administered 200, 60, 20, or 2 μg of SKT05, SKT20, or 200 μg of a control, one day prior to infection with TC-83. Mice were followed for weight loss (E, H) and survival (F, I) for 14 days. (G, J) Viral loads were determined in the brains of mice at 5 dpi (n = 8/group; 2 independent experiments). Statistical significance was determined by a one-way ANOVA with a Dunnett’s post-test of AUC analysis from 0–8 dpi comparing each group to the 200 μg group (E and H), Log-rank test compared to 200 μg group (F and I), or Kruskal-Wallis with a Dunn’s post-test comparing each group to the 200 μg dose (G and J). (K-O) C3H/HeN mice were administered 200 μg of SKT14, SKT14 LALA-PG, or a control mAb one day prior to infection with TC-83. Mice were followed for weight loss (K and N) and survival (L and O). Additional mice were sacrificed at 5 dpi to determine viral loads (M) in brain tissues by RT-qPCR (data related to SKT05 and SKT20 is the same as the 200 μg doses of in G, J) (n = 8/group; 2 independent experiments). Statistical significance was determined by a Log-rank test compared to the SKT14 group (L and O) or Kruskal-Wallis with a Dunn’s post-test compared to the control group (M). (P-S) C3H/HeN mice were administered 200 μg or 2 mg of SKT14 LALA-PG or SKT20 LALA-PG, 200 μg of SKT14 or SKT20, or 2 mg of a control mAb one day prior to infection with TC-83. Mice were followed for survival (P, R) and weight-loss (Q, S) for 14 days (n = 8/group; 2 independent experiments). Statistical significance was determined by a Log-rank test (P and R) or a one-way ANOVA with a Dunnett’s post-test of AUC analysis from 0–7 dpi comparing each group to the 200 μg SKT14 or SKT20 group (Q and S). For viral loads, 1035 bars represent the median. Weight loss is shown as mean ± SEM.

