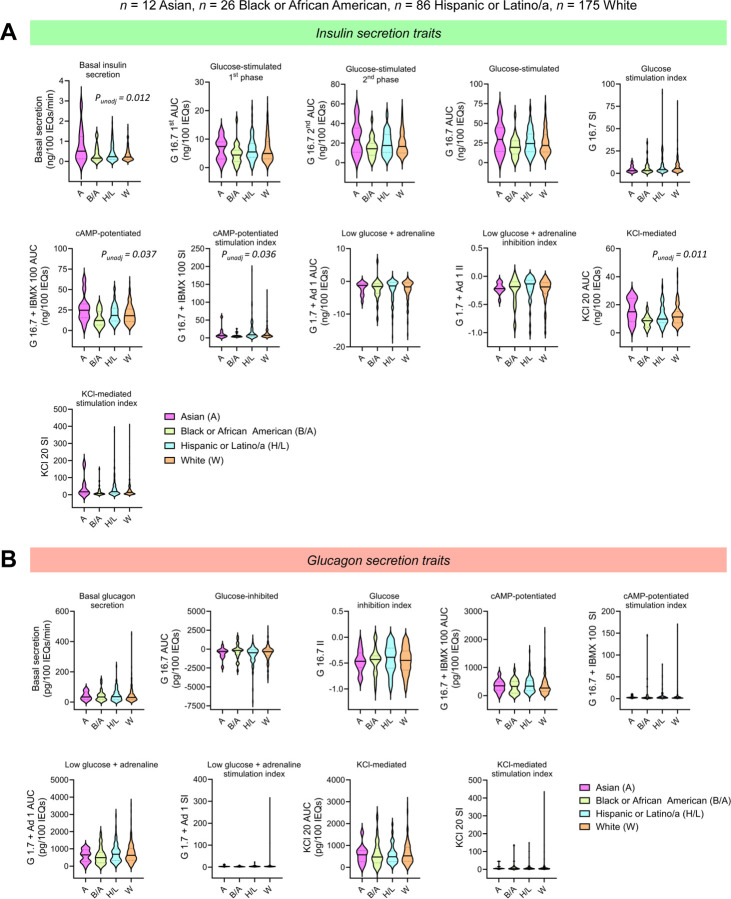
Figure 4. Islet secretion traits by reported race or ethnicity.
Violin plots comparing (A) insulin and (B) glucagon secretion traits by reported race or ethnicity (n = 12 Asian, n = 26 Black or African American, n = 86 Hispanic or Latino/a, n = 175 White). The solid line in each violin plot depicts the median, and the dotted lines represent the 1st and 3rd quartiles. Global p-value is based on the F-test while controlling for the seven covariates (age, sex, BMI, HbA1c, islet isolation center, pre-shipment culture time, and islet transit time) and adjusting for multiple comparisons. Comparisons where the unadjusted p-value (punadj) was significant are noted in italics.

