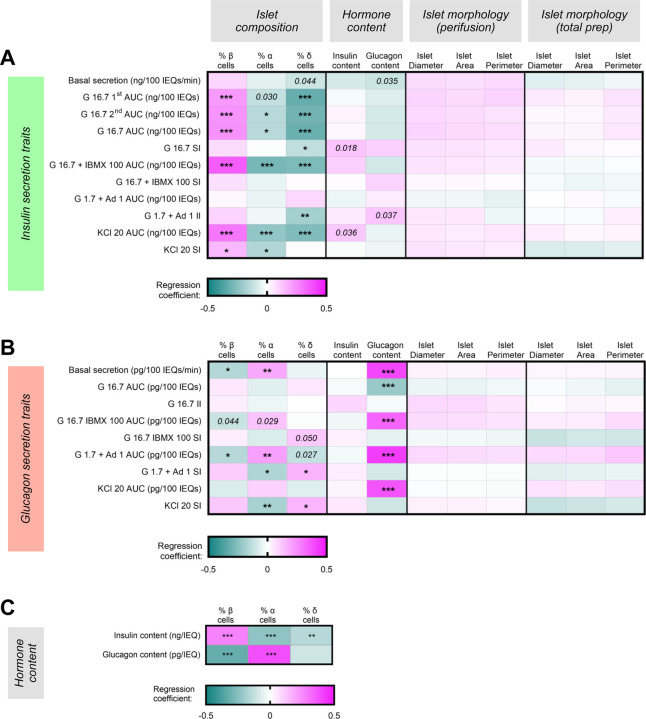
Figure 5. Islet composition and hormone content are associated with multiple islet secretory traits.
(A-B) Heatmaps depicting regression coefficients of each morphologic variable for islets that underwent perifusion (n = 186), islet composition variable (n = 299), and total islet insulin and glucagon content (n = 299) after being incorporated into multivariable regression models controlling for age, sex, BMI, HbA1c, islet isolation center, reported race or ethnicity, pre-shipment culture time, and islet transit time for each (A) insulin or (B) glucagon secretion trait. (C) Heatmaps depicting regression coefficients of each islet composition variable after being incorporated into multivariable regression models for total insulin or glucagon content after adjusting for the eight covariates (n = 299). Adjusted p-values are indicated where *p < 0.05, **p < 0.01, and ***p < 0.001. Comparisons where the unadjusted p-value (punadj) was significant are noted in italics.

