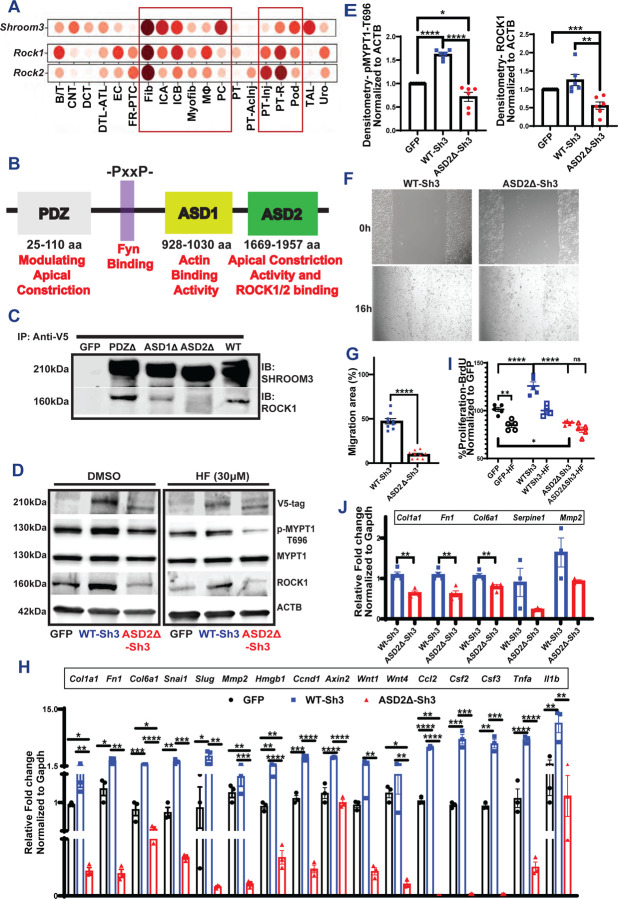
Figure 1:
(A) Dot plot representing Shroom3, Rock1, Rock2 in multiple cell types identified in Injured murine kidneys (https://humphreyslab.com/SingleCell/) (B) The conserved domains of Shroom3 are shown (PDZ, ASD1, ASD2 domains and the Fyn-binding site). (C) Representative immunoblots of SHROOM3 and ROCK1 from proteins immunoprecipitated from HEK293T cells overexpressing PDZ, ASD1 and ASD2 using V5 beads. (D) Representative immunoblots of lysates from Dmso/HF-treated mIMCD cells overexpressing GFP, WT-Sh3 and ASD2Δ-Sh3 for V5 (Shroom3), phospho-MYPT, total MYPT, ROCK1 and βACTIN. (E) Dot plots of relative quantification of phospho-MYPT and ROCK1. (F) Phase contrast micrographs of wound closure in mIMCD cells expressing WT-Sh3/ASD2Δ-Sh3 and the (G) Bar graph representing the percent migrated area. (H) Bar graph representing the relative mRNA expression of markers of fibrosis, Wnt signals and pro-inflammatory chemokines in mIMCD cells (WT-Sh3- vs ASD2Δ-Sh3). (I) Dot plot showing the difference in cell proliferation in the 3T3 fibroblasts overexpressing WT-Sh3- vs ASD2Δ-Sh3/GFP-control with and without Fasudil (HF). Data is depicted as the BrdU incorporation by cells as percent of GFP-control. (J) Bar graph representing the relative mRNA expression of markers of fibrosis and EMT in 3T3 cells (WT-Sh3- vs ASD2Δ-Sh3). [Line and whiskers indicate mean ± SEM; Unpaired T-test *p < 0.05, **p < 0.01, ***p < 0.001, ****p < 0.0001].

