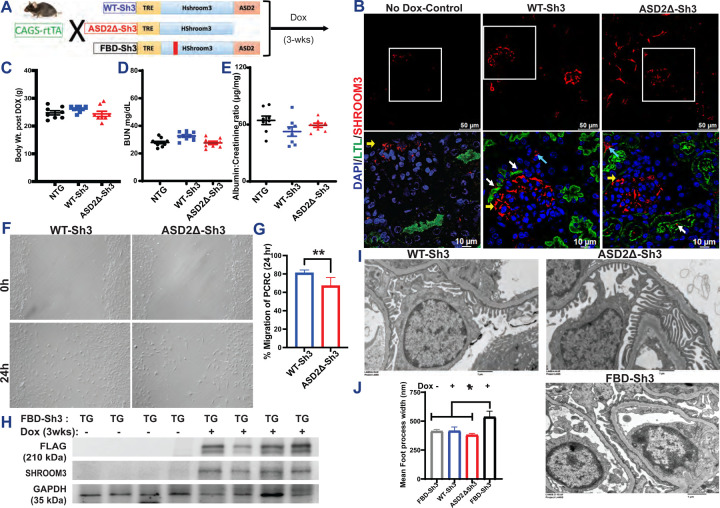
Figure 2:
(A) Schema of generation of the Tetracycline-inducible global overexpression mice for WT-Sh3, ASD2Δ-Sh3 and FBD-Sh3. (B) Validation of the overexpression histologically by immunostaining for SHROOM3 (Red) in upper panel; Scale bar: 50 mM. The insets (lower panel) show co-staining with Lotus tetragonolobus lectin [LTL], Green and the white, yellow and blue arrows marking the tissue localization; Scale bar: 10 mM. Dot plots of baseline measurements of (C) Body weights (D) blood urea nitrogen (BUN) and (E) Albumin to creatinine ratio post Doxycycline induced overexpression in Non-transgenic (NTG)/WT-Sh3/ASD2Δ-Sh3 mice (F) Phase contrast micrographs of wound closure in Primary culture renal cells (PCRCs) isolated from WT-Sh3/ASD2Δ-Sh3 transgenic (TG) mice and the (G) Bar graph representing the percent migrated area (12 hpf lengths/well & 2 wells/line). (H) Representative immunoblots of whole kidney lysates from FBD-Sh3 mice probed for SHROOM3 and FLAG confirming overexpression on DOX induction. (I) Representative electron micrographs of glomeruli of WT-Sh3/ASD2Δ-Sh3 vs FBD-Sh3 TG mice revealing the foot processes effacement in FBD-Sh3. (J) Bar graph depicting the mean foot process width [Line and whiskers indicate mean ± SEM; Unpaired T-test *p < 0.05, **p < 0.01].

