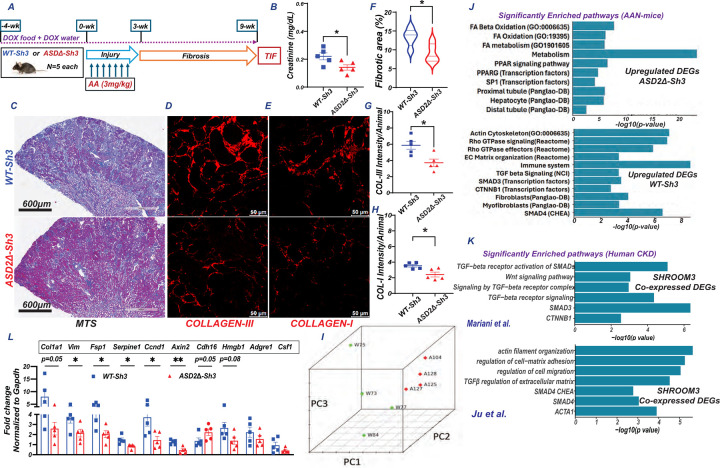
Figure 3:
(A) Schema of AAN injury/TIF in CAGS-rTTA/WT-Sh3 or -ASD2Δ-Sh3 [n=5 each] (B) Dot plot of serum creatinine levels in AAN mice at 9-wks. Representative images of (C) slide-wide Masson’s Trichrome staining (MTS-4x) and (D) Collagen III and (E) Collagen I immunofluorescence to evaluate fibrosis in AAI-injured kidney. Scale bar: MTS- 600 μm; IF: 50 μm. Dot plots denoting the quantification of (F) fibrotic area (10 hpf per animal) and mean fluorescence intensities (12 hpf per animal) of (G) Collagen III and (H) Collagen I. (I-K) Bulk transcriptome evaluation by RNAseq was performed at 9-wks CAGS-rtTA- WT-Sh3 or -ASD2Δ-Sh3 mice (n=4 each). (I) Principal component analyses plot shows clustering between conditions Bar graphs show significantly selected enriched pathways from these analyses in (J) DEGs upregulated in ASD2Δ-Sh3 (upper panel) or WT-Sh3 (lower), while in (K) bar graphs show analogous pathways obtained from genes co-expressed with SHROOM3 in 2 human CKD datasets. (L) Bar graph representing the relative mRNA expression (qPCR) of fibrotic/injury, inflammatory and tubular markers between transgenic lines. [Line and whiskers indicate mean ± SEM; Unpaired T-test*p < 0.05, **p < 0.01; DEGs=Differentially expressed genes].

