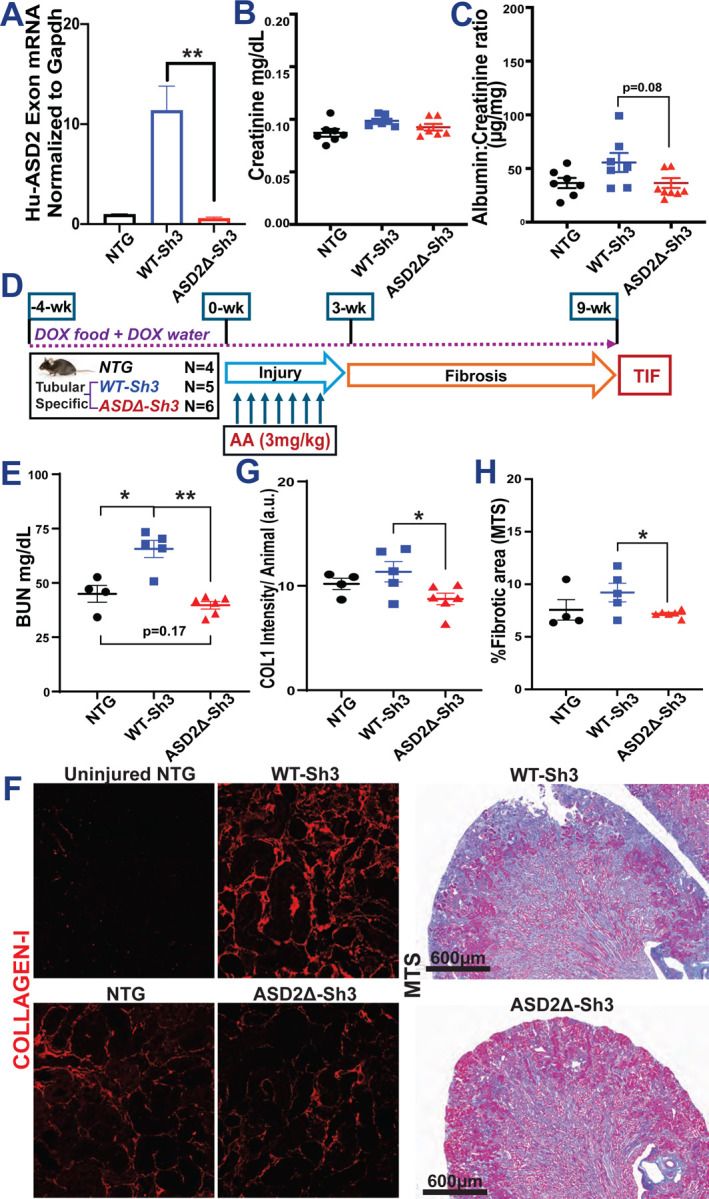
Figure 5:

(A) Bar graph representing the relative mRNA expression by qPCR using ASD2-domain specific primers in tubular-specific (Pax8-rtTA) WT-Sh3 overexpression mice vs. Pax8-rtTA-ASD2Δ-Sh3 mice and non-transgenic controls. Dot plots of baseline levels of (B) serum creatinine and (C) urine albumin to creatinine ratios in DOX-treated Pax8-rtTA mice and non-transgenic mice. (D) Schema of generation of Aristolochic acid nephropathy (AAN) in tubular-specific overexpression WT-Sh3/ASD2Δ-Sh3 mice entailing injury followed by recovery phase with fibrosis. (E) Dot plot showing the BUN levels in AAI-injured Pax8-Shroom3 mutant mice at 9 wk. (F) Representative fluoromicrographs (20X) of Collagen I immunostaining and slide-wide photomicrographs of Masson’s Trichrome staining (MTS) to evaluate fibrosis in AAI-injured kidney. Dot plots denoting the (G) mean fluorescence intensities (12 hpf per animal) of Collagen I immunostained sections and (H) quantification of blue-stained area (10 hpf per animal) in Trichrome-stained sections. [Line and whiskers indicate mean ± SEM; Unpaired T-test*p < 0.05, **p < 0.01]
