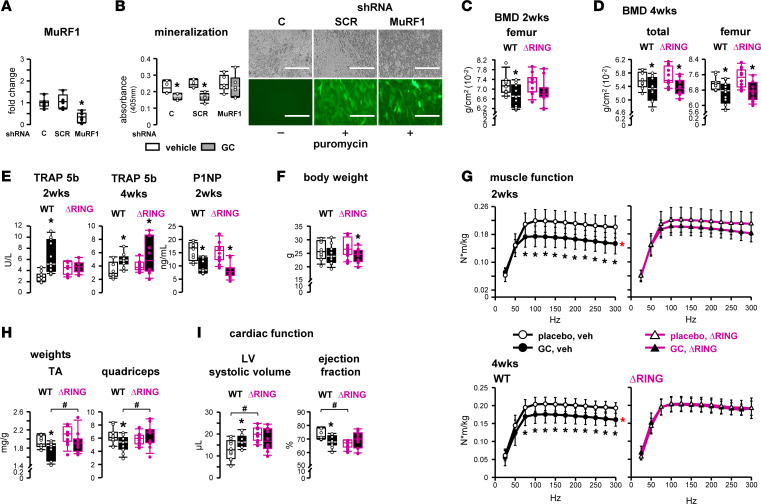
Figure 6. Loss of MuRF1-mediated ubiquitination prevents GC dysfunction in skeletal and cardiac muscle, but only temporarily in bone, in vivo.
(A and B) MuRF1 expression was quantified by qPCR in OB-6 cells not infected (controls [C]) or infected with GFP-labeled lentivirus containing scramble shRNA (SCR) or shRNA directed to silence MuRF1. (A) *P < 0.05 vs. non-infected cells by 1-way ANOVA, Dunnett’s method post hoc test. (B) Mineralization was visualized by Alizarin Red S staining followed by optical density quantification (absorption 405 nm), read in duplicate. Representative images for GFP visualization are shown. Scale bars: 200 μm. n = 4–6, *P < 0.05 vs. vehicle-treated, by Student’s t test. (C–I) WT littermates and mice lacking MuRF1-mediated ubiquitination due to deletion of the RING region (ΔRING) were implanted with slow-release pellets delivering 2.1 mg/kg/d (GC) prednisolone or placebo. (C and D) BMD and (E) sera TRAP 5b and P1NP, (F) mouse body weights, and (H) wet weight of isolated muscles. n = 10–12. *P < 0.05 vs. corresponding placebos, #P < 0.05 vs. corresponding WTs, by 2-way ANOVA, Tukey’s post hoc test. (G) Skeletal muscle function, as assessed by plantarflexion torque in vivo testing, measured after 2 and 4 weeks of the indicated treatments. n = 10–12. *P < 0.05 vs. corresponding placebo treated. Main group effects are indicated by red symbols: red *P < 0.05 all corresponding placebos vs. all corresponding GC by 2-way repeated-measures ANOVA, Tukey’s post hoc test. (I) Left ventricle (LV) systolic volume and ejection fraction, as assessed by ultrasound echocardiography. n = 11–12. *P < 0.05 vs. corresponding placebos, #P < 0.05 vs. corresponding WT, by 2-way ANOVA, Tukey’s post hoc test.

