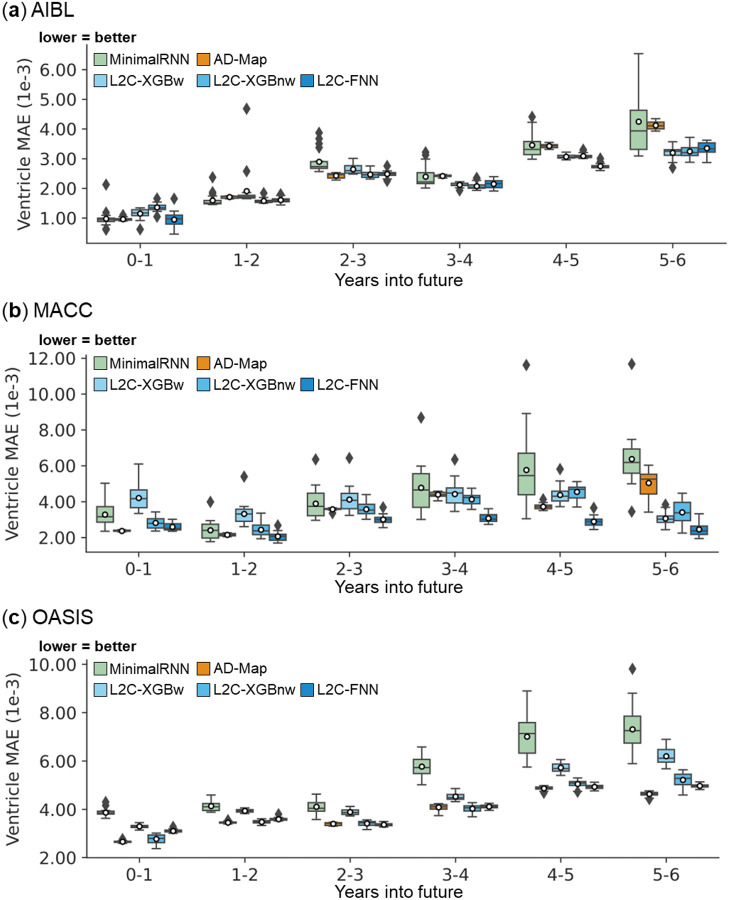
Figure 11. Cross-cohort ventricle volume prediction performance (Figure 5) broken down into yearly intervals up to 6 years into the future.
Note that the last observed time point is at month 0, so year 0–1 means that the prediction was for a future observation at 0 < month ≤ 12, year 1–2 means that the prediction was for a future observation at 12 < month ≤ 24, etc. All algorithms became worse further into the future. L2C-FNN was comparable to or better than all models across all years in three external test datasets.

