Fig. 2.

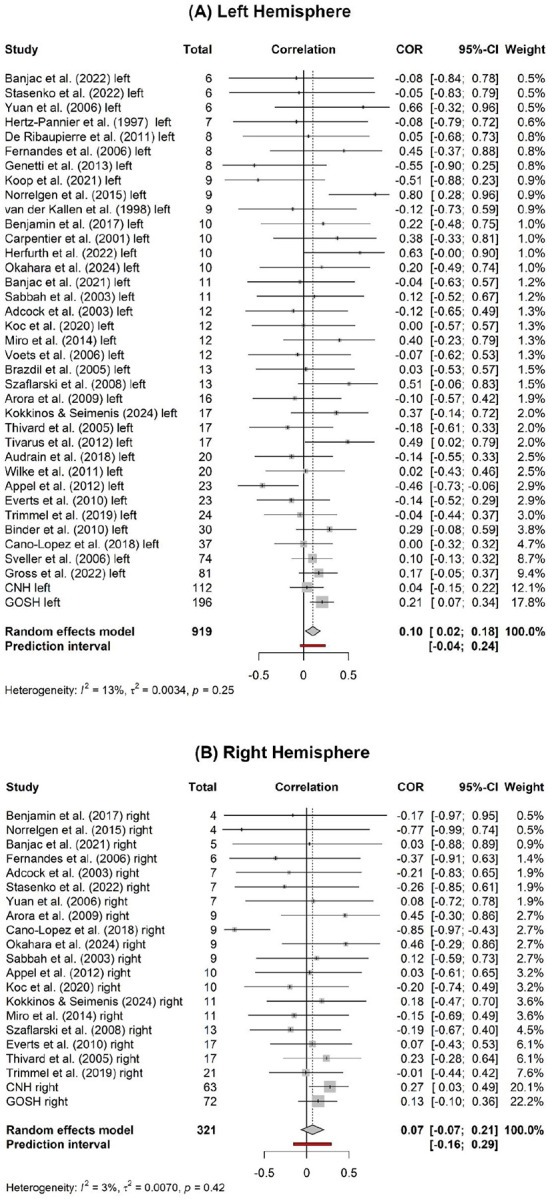
Forest plots showing the individual effect sizes for each study and pooled effect size (dashed line) of the correlation between age at seizure onset and LI in the left (A) and right hemisphere (B) epilepsy groups.

Forest plots showing the individual effect sizes for each study and pooled effect size (dashed line) of the correlation between age at seizure onset and LI in the left (A) and right hemisphere (B) epilepsy groups.