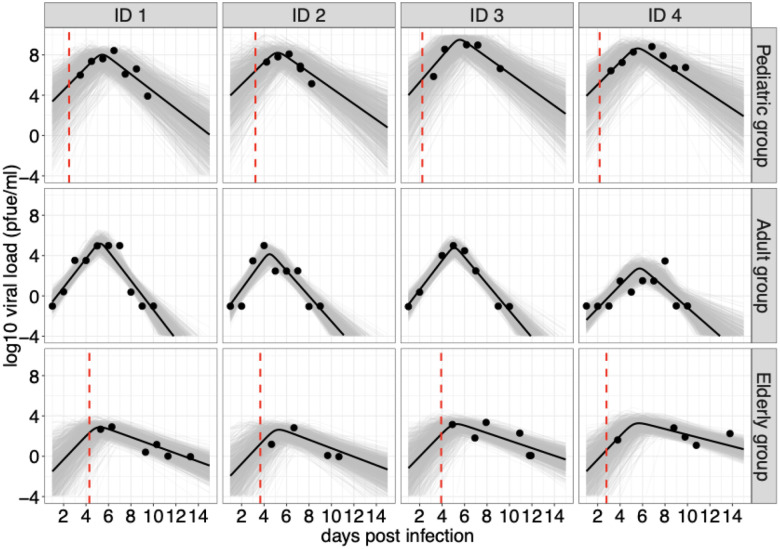
Figure 1. Model fits to viral kinetic data of RSV infections in different age groups.
Data are presented with solid circles, and solid lines are median predictions of viral load. The dashed red lines indicate the median estimates of the time of symptom onset relative to time of infection for the pediatric and elderly groups. Note that the median predictions of viral load are calculated using estimated parameters for each individual. Gray curves are 1000 simulated viral load trajectories based on the joint posterior distribution. Four individuals from each age group were selected for presentation; results for all individuals are provided in Fig. S1–S3.

