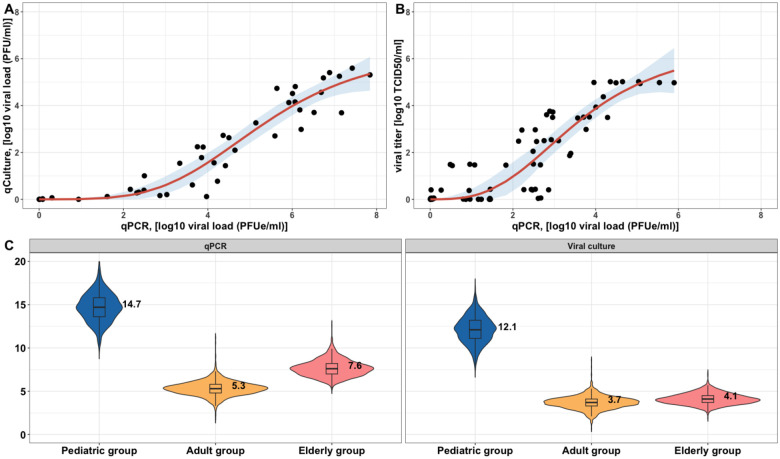
Figure 3. The characterization of the relationship between the viral concentration measured by qPCR and viral culture.
The best fit of using a saturation model (in a form of , where is the viral load measured by qPCR) to the data from (A) [17], log10(PFU/ml), log10(PFUe/ml) and (B) [15], log10(TCID50/ml), log10(PFUe/ml). Black circles are data points. Mean predictions are given by the red curves, and the shaded areas indicate a 95% confidence interval. 12,500 samples are drawn from the population-level posterior distribution to calculate (C) viral shedding period (in days) (defined as the duration when viral load (measured by qPCR or viral culture) is above 10 PFUe/ml or PFU/ml) for different age groups.

