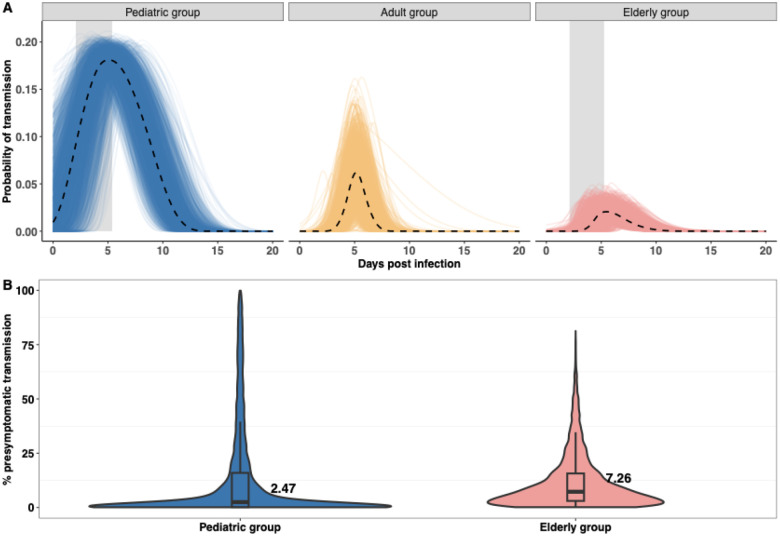
Figure 4. Probability of transmission and predicted presymptomatic fractions in different age groups.
(A) 12,500 population-level samples are drawn from the posterior distribution to calculate the probability of transmission as time-series in different age groups, given the median estimates of infection probability from [18–20]. Dashed lines indicate the median trajectory, and shaded areas indicate estimated incubation period in the pediatric and elderly group. (B) The percentage of presymptomatic transmissions for the pediatric group and the elderly group based on the 12,500 population-level posterior samples.

