Extended Data Figure 4.
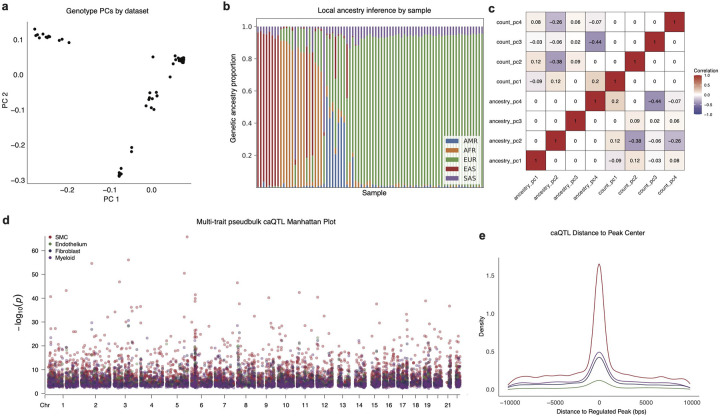
Genotyping and pseudobulk caQTL discovery. (a) PC1 and 2 for genotyping data (post imputation from the TOPMED panel and filtering for variants with imputation R2 < 0.3 and MAF > 0.05) panel for each sample. (b) Local ancestry inference (YRI (n=186) and CEU (n=183) from the 1000 Genome Project102 were used as AFR / EUR reference populations, respectively.) genetic proportion stack plot by sample. (c) Correlation heatmap for ancestry PCs and ATAC count PCs. (d) Multi-trait pseudobulk Manhattan plot for caQTL colored by cell type genome wide. (e) Distance from caQTL to the regulated peak colored by cell type.

