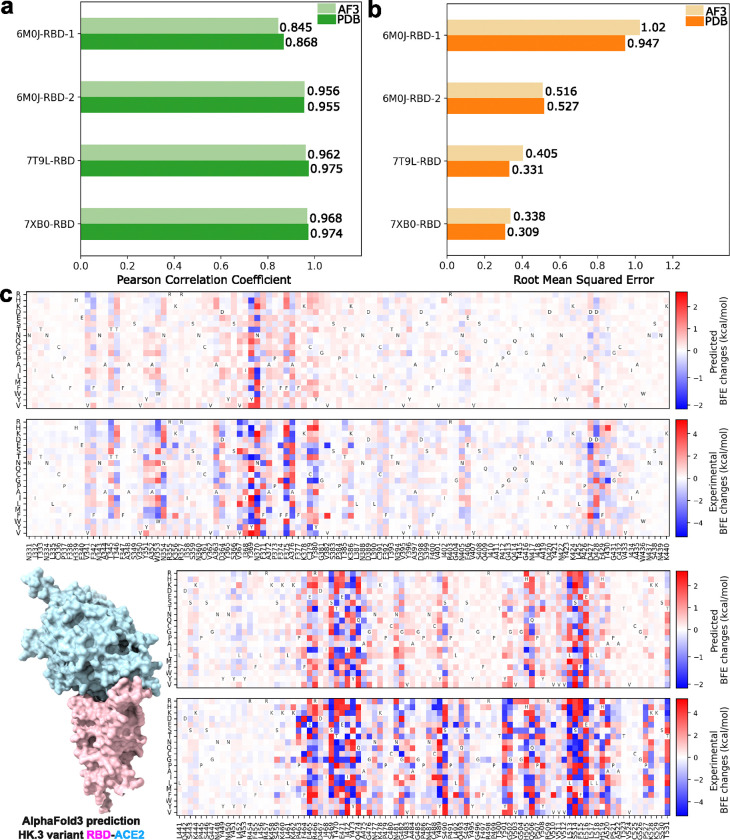
Figure 1:
(a): Comparison of AF3-assisted MT-TopLap’s Pearson correlation coefficient (PCC) values for the 10-fold cross-validation on four SARS-CoV-2 RBD-ACE2 DMS datasets with AF3 structures against experimental structures. Higher PCC values indicate better results. (b): Comparison of AF3-assisted MT-TopLap’s root mean square error (RMSE) for the 10-fold cross-validation on four SARS-CoV-2 RBD-ACE2 DMS datasets with AF3 structures against experimental structures. Lower RMSE values indicate better results. (c): The AF3 structural predicted HK.3 RBD-ACE2 complex and its predicted DMS data (top) by AF3-assisted MT-TopLap. DMS predictions are obtained by performing a 10-fold cross-validation using the experimental DMS data (bottom). The x-axis labels represent the RBD residues and its wild amino acid types. The y-axis labels represents the mutant amino acid types.

