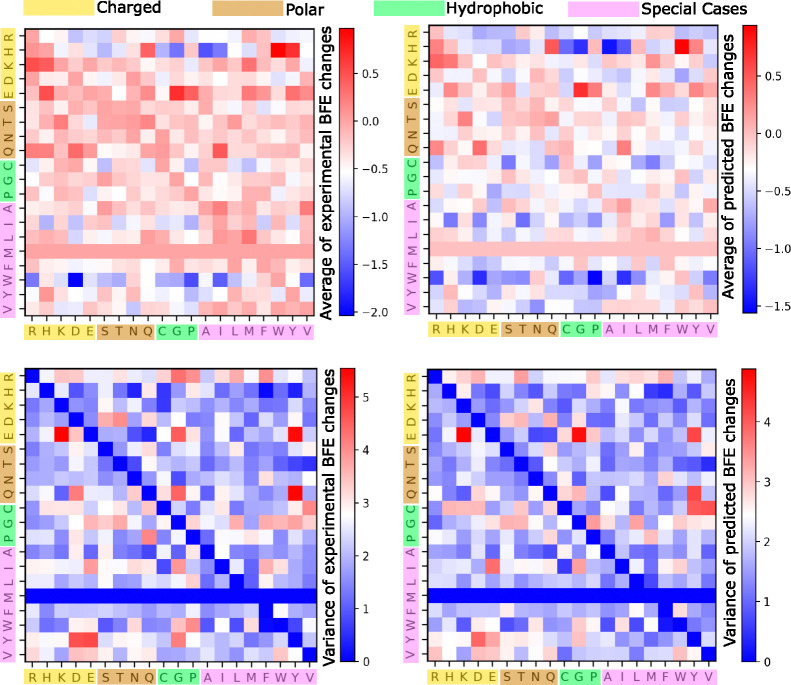
Figure 3:
A comparison of average experimental and predicted BFE changes following mutations associated with different amino acid types for all the four SARS-CoV-2 RBD-ACE2 DMS datasets. The x-axis labels the residue type of the original RBD amino acids, whereas the y-axis labels the residue type of the mutant. Note that there is no amino acid MET (M) on RBD mutations. Top: Average BFE changes following mutation. Bottom: Variance of BFE changes following mutation. Left: Experimental values. Right: Predicted values.

