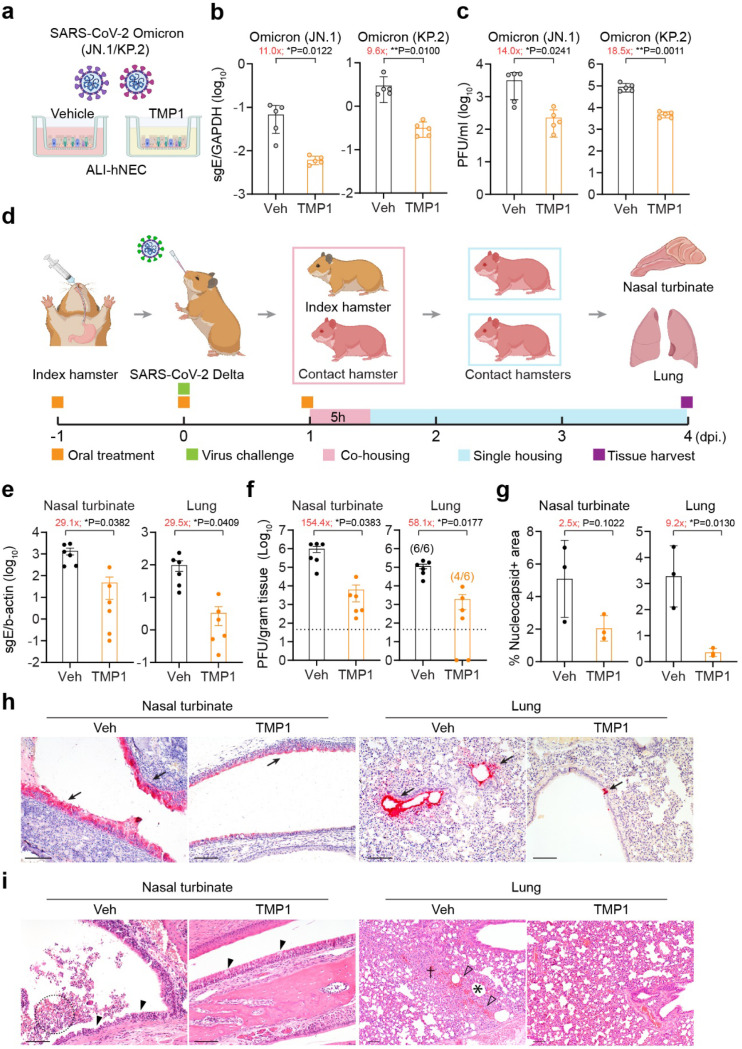
Figure 3. Efficacy of TMP1 in blocking SARS-CoV-2 transmission.
(a) Schematic illustration of SARS-CoV-2 infection in human nasal epithelial cells (hNECs). Differentiated hNECs maintained in air-liquid interface (ALI) culture were pretreated with 20 μM TMP1 or vehicle for 1 hour. After 1 h, cells were washed and infected with SARS-CoV-2 Omicron JN.1 (n=5) or KP.2 (n=5). At 2 hpi., medium at the both apical and basal side were replenished with TMP1 or vehicle only until sample harvest at 48 hpi.
(b) Quantification of sgE gene in the infected cell lysates at 48 hpi. by RT-qPCR analysis.
(c) Quantification of the infectious viral titres in the apical supernatants harvested from the infected hNECs at 48 hpi. by plaque assays.
(d) Schematic illustration of the transmission study in golden Syrian hamsters. Index hamsters (n=6) were orally treated with 90 mg/kg TMP1 together with 12 mg/kg RTV oral delivery of TMP1 or vehicle one day prior to infection. On the infection day (Day 0), index hamsters were infected with 2000 PFU SARS-CoV-2 Delta. Treatment in the index hamsters continued until they were co-housed with naïve contact hamsters (n=6) for 5 hours to allow virus transmission. Contact hamsters were separated for single housing until sample harvest on 4 dpi..
(e) Quantification of sgE gene of SARS-CoV-2 in the nasal turbinate and lung tissues of the contact hamsters at 4 dpi by RT-qPCR analysis.
(f) Quantification of the infectious viral titres in the nasal turbinate and lung tissues of the contact hamsters 4 dpi by plaque assays.
(g) Quantification of viral antigen expression in nasal turbinate and lung tissues of the contact hamsters at 4 dpi. by IHC staining. Quantification was performed with ImageJ.
(h) Representative images of SARS-CoV-2 nucleocapsid (N) protein expression (black arrow) in nasal turbinate and lung tissue of the contact hamsters at 4 dpi. by IHC staining. Scale bar represents 100 μm.
(i) Histology analysis of the nasal turbinate and lung tissue of the infected at 4 dpi. by H&E staining. Black arrowhead, nasal epithelial desquamation; dashed circle, necrotic cell debris in the nasal cavity; open arrowhead, haemorrhage in the alveolar septa; asterisk, alveoli collapse; cross, inflammatory infiltration in alveolar septa. Scale bar represents 100 μm.
Each data point represents one biological repeat. Data represents mean ± SD from the indicated number of biological repeats. Statistical significances were determined using two-tailed Student’s t-test (b-c) and (e-g). Data were obtained from three independent experiments. * represented p < 0.05 and ** represented p < 0.01. Veh, vehicle.

