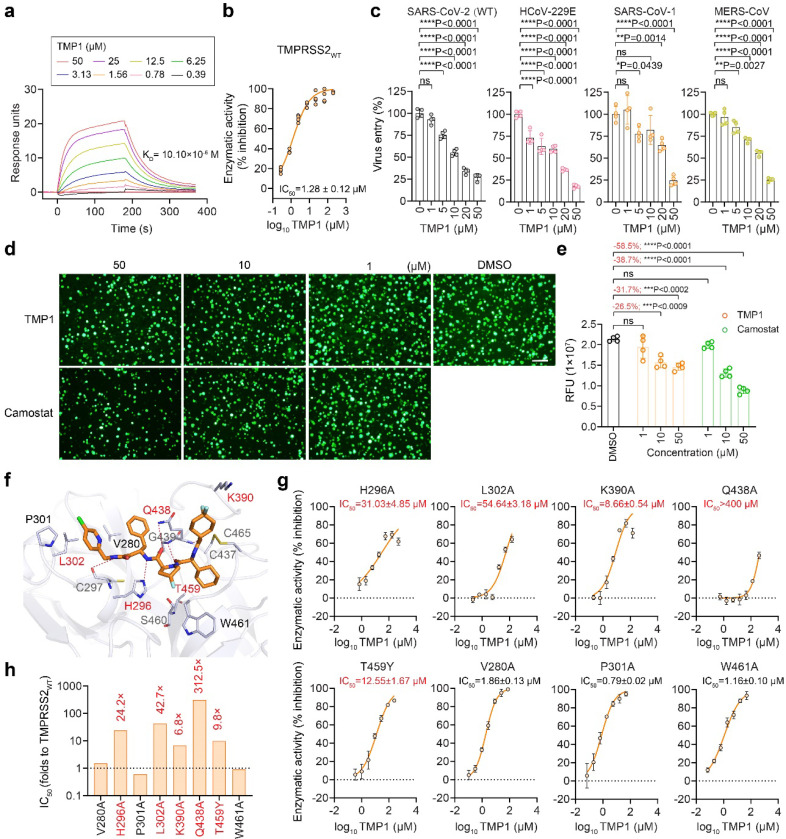
Figure 5. Specific inhibition of TMP1 against TMPRSS2 enzymatic activity and TMPRSS2-dependent pseudovirus entry.
(a) Surface plasmon resonance (SPR) analysis of TMP1 with TMPRSS2.
(b) Enzymatic activity of recombinant TMPRSS2 with TMP1 treatment. Enzymatic activity of the recombinant TMPRSS2 was measured by fluorescence resonance energy transfer (FRET) assays (n=4). Fluorescence signals were normalized to the readouts of mock-treated wells.
(c) Inhibition of pseudovirus entry by TMP1. VeroE6-TMPRSS2 and Huh7 cells were pre-treated with TMP1 for 1 h. VeroE6-TMPRRS2 cells were transduced with pseudoviruses carrying SARS-CoV-2 wildtype spike (S) (n=4). Huh7 cells transfected with TMPRSS2 were transduced with pseudoviruses carrying SARS-CoV-1-S (n=4), MERS-CoV-S (n=4) or HCoV-229E-S (n=4). Pseudovirus entry was quantified by measuring the luciferase signal at 24 hours post transduction. Luminescence signals were normalized to the readouts of mock-treated wells.
(d) Representative images of TMPRSS2-dependent cell-cell fusion. 293T cells were co-transfected with SARS-CoV-2-S and GFP1–10 (effectors cells). Target cells followed were co-transfected with hACE2, TMPRSS2, and GFP11 (target cells). Prior to effector and target cell co-culture, target cells were pre-treated with TMP1 or camostat for 30 mins, followed by co-culture at 1:1 ratio for 24 hours in the presence of TMP1 and camostat. TMPRSS2-mediated cell-cell fusion was visualized by immunofluorescence microscope. Scale bar represents 200 μm.
(e) Quantification of the fluorescence signals of cell-cell fusion assays as described in Figure 5d. Quantification of the fluorescence signals were performed with ImageJ. RFU, relative fluorescence units.
(f) Mode of binding between TMPRSS2 (in blue-white, PDB accession: 7MEQ) and TMP1 (in orange). Residues in close proximity of the interaction interface were shown as blue-white sticks. Key amino acids confirmed by mutagenesis assays were highlighted in red. The distally-located amino acid W461 included as negative control in the mutagenesis assay was also shown. Hydrogen bonds were represented as red dashed lines.
(g) Enzymatic assays with TMPRSS2 mutants carrying key residues located in the TMP1-TMPRSS2 interaction interface. Enzymatic activities of the recombinant TMPRSS2 mutants with or without TMP1 treatment were determined by FRET-based enzymatic assays (n=4). Enzymatic activities were determined by normalization of the fluorescence signals to the readouts of mock-treated control wells.
(h) Fold change of change in IC50 of TMP1 against TMPRSS2 mutants compared with wildtype TMPRSS2.
Each data point represents one biological repeat. Data represents mean ± SD from the indicated number of biological repeats. Statistical significances were determined using one way-ANOVA with Dunnett’s multiple comparisons test (c) and (e). Data were obtained from three independent experiments. * represented p < 0.05 and ** represented p < 0.01, **** represented p < 0.0001, ns, not statistically significant.

