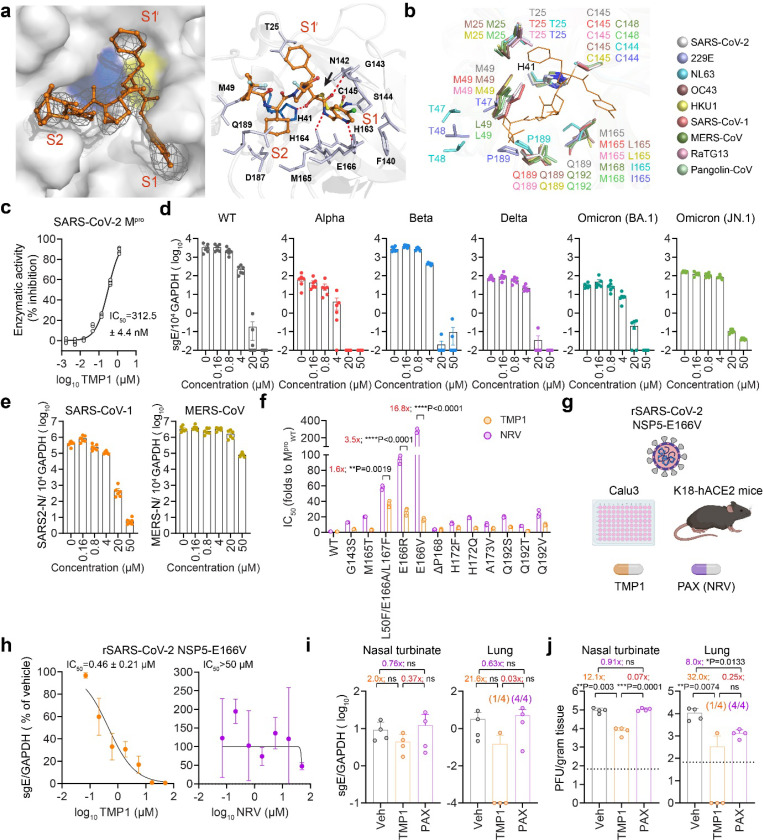
Figure 6. Specific inhibition of TMP1 against coronavirus Mpro and its antiviral efficacy against nirmatrelvir-resistant SARS-CoV-2 escape mutant.
(a) Crystal structure of TMP1 in complex with SARS-CoV-2 Omicron Mpro. Left panel, The co-crystal structure (PDB: 9IZB) of TMP1 (orange) in complex with SARS-CoV-2 Omicron Mpro (grey). The H41 (blue) and C145 (yellow) catalytic dyad was shown. The S1′, S1, and S2 pockets of Mpro are labelled in red. The Fo-Fc electron density map of TMP1 is shown in gray mesh (σ = 2.5). Right panel, close-up view of TMP1 with the substrate binding pocket of Mpro. The residues of Mpro involved in TMP1 binding were displayed by sticks. The hydrogen bonds were displayed as red dashed lines. The covalent-bond between Cys145 and TMP1 warhead was indicated by a black arrow.
(b) Superimposition of the TMP1 in complex with Mpro from 9 coronaviruses including SARS-CoV-2 (Omicron, PDB: 9IZB), HCoV-229E (PDB: 2ZU2), -NL63 (7E6M), -OC43, -HKU1, SARS-CoV-1 (PDB: 1WOF), MERS-CoV (PDB: 4RSP), RaTG13 and GX/P3B.
(c) Enzymatic activity of recombinant SARS-CoV-2 Mpro with TMP1 treatment. Enzymatic activity of the recombinant SARS-CoV-2 Mpro was measured by fluorescence resonance energy transfer (FRET) assays (n=4). Fluorescence signals were normalized to the readouts of mock-treated wells.
(d) Quantification of the sgE gene in VeroE6 cells (n=6) infected with wildtype SARS-CoV-2 and Alpha, Beta, Delta, Omicron (BA.1 and XBB1.5) variants, followed by treatment with TMP1 or vehicle only at 1 hpi.. Lysates were harvested at 24 hpi. for one-step reverse transcription and quantitative polymerase chain reaction (RT-qPCR) analysis.
(e) Quantification of the N gene of SARS-CoV-1 and MERS-CoV in VeroE6 cells (n=6) infected with SARS-CoV-1 or MERS-CoV, followed by treatment with TMP1 or vehicle only at 1 hpi.. Lysates were harvested at 24 hpi. for one-step reverse transcription and quantitative polymerase chain reaction (RT-qPCR) analysis.
(f) Sensitivity of recombinant SARS-CoV-2 Mpro mutants to TMP1 treatment. Inhibition of TMP1 against the recombinant SARS-CoV-2 Mpro mutants carrying reported nirmatrelvir-resistant mutations was measured by fluorescence resonance energy transfer (FRET) enzymatic assays (n=3). Fold change in the IC50 was obtained by comparing with that of the wildtype Mpro.
(g) Schematic illustration of characterizing the in vitro and in vivo antiviral efficacy of TMP1 against nirmatrelvir-resistant recombinant SARS-CoV-2. Recombinant SARS-CoV-2 was constructed with NSP5-E166V mutation in the background of ancestral SARS-CoV-2 with D614G mutation in the spike (rSARS-CoV-2-NSP5-E166V). For in vitro infection, Calu3 cells were pretreated with TMP1 for 1 hour followed by infection with rSARS-CoV-2-NSP5-E166V (n=4). Lysates were harvested at 24 hpi. for RNA extraction. For in vivo infection, 8- to 12-week-old K18-hACE2 transgenic mice were challenged with 5000 PFU rSARS-CoV-2-NSP5-E166V. One day prior to infection, mice were orally treated with 100 mg/kg/dose TMP1 in combination with 20 mg/kg/dose RTV (n=4). Control mice were treated with vehicle only (n=4). Mice were treated twice per day until sample harvest at 3 dpi.
(h) Quantification of the sgE gene in Calu3 cells (n=6) infected with rSARS-CoV-2-NSP5-E166V, followed by treatment with TMP1 or vehicle only at 1 hpi.. Lysates were harvested at 24 hpi. for one-step reverse transcription and quantitative polymerase chain reaction (RT-qPCR) analysis.
(i) Quantification of SARS-CoV-2 sgE gene in the nasal turbinate and lung tissues of the rSARS-CoV-2-NSP5-E166V infected mice at 3 dpi by RT-qPCR analysis.
(j) Quantification of the infectious viral titres in the nasal turbinate and lung tissues of the rSARS-CoV-2-NSP5-E166V infected mice at 3 dpi by plaque assays.
Each data point represents one biological repeat. Data represents mean ± SD from the indicated number of biological repeats. Statistical significances were determined using one way-ANOVA with Dunnett’s multiple comparisons test (i-j) and two-tailed Student’s t-test (f). Data were obtained from three independent experiments. * represented p < 0.05, ** represented p < 0.01, *** represented p < 0.001, ns, not statistically significant. Veh, vehicle; NRV, nirmatrelvir; PAX, Paxlovid.

