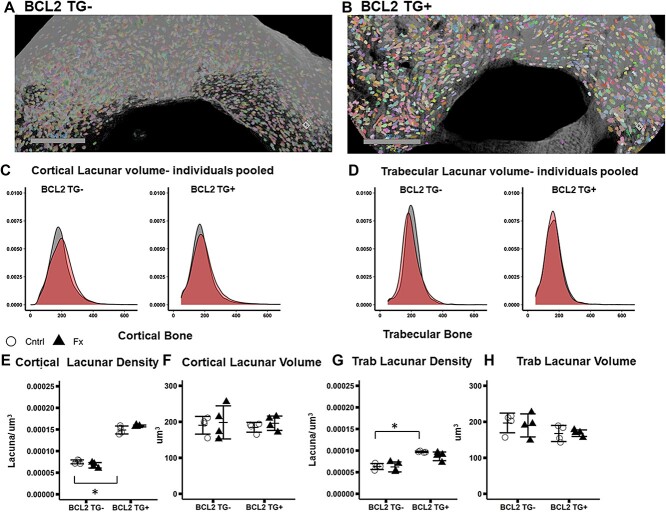
Figure 6.
X-ray microscopy imaging of lacunar volume and density in contralateral (uninjured) tibia. Group sizes: TG- Cntrl: 4, TG- Fx: 4, TG+ Cntrl: 4, TG+ Fx: 4. (a-b) Representative images of tibial cortical bone ROI for (A) BCL2 TG- and (B) BCL2TG+. (C) Cortical lacunar volume by genotype and fracture. (D) Trabecular lacunar volume by genotype and fracture. (E-H) Lacunar density and average lacunar volume for cortical and trabecular bone ROIs. BCL2 TG+ mice have higher lacunar density but average lacunar volume does not differ by genotype (E-H). *p < 0.05. Abbreviations: BCL2, B-cell lymphoma 2; TG-, non-transgenic; TG+, transgenic.

