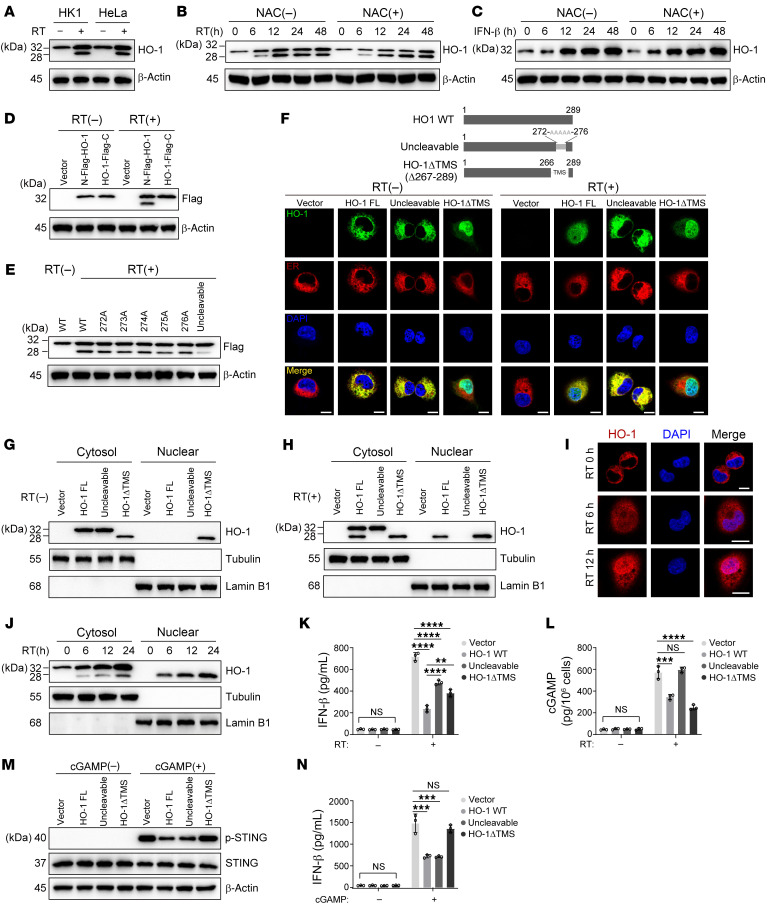
Figure 4. RT induces HO-1 and promotes its cleavage.
(A) Immunoblot analysis of HO-1 expression and truncation in the indicated cells before and after RT. (B and C) Immunoblot analysis of HO-1 expression and truncation in HK1 cells after RT (B) or IFN-β treatment (C) combined with or without NAC treatment. (D and E) Immunoblot analysis of Flag–HO-1 expression in HK1 cells before and after RT. (D) Flag tag was fused to N-terminus or C-terminus of HO-1, respectively. (E) Mutating S272-F276 of HO-1 individually or mutating all 5 amino acids between S272 and F276. (F) Subcellular distribution (ER and nucleus) of full-length HO-1, uncleavable HO-1 mutant, cleaved HO-1 (HO-1ΔTMS) in HK1 cells with or without RT. Calreticulin staining for the ER; DAPI staining for the nucleus (scale bars: 10 μm). FL, full-length. (G and H) Nuclear and cytoplasmic protein extraction experiment was performed to determine the cellular localization of exogenous HO-1 or its mutants before (G) and after (H) RT in HK1 cells. (I) Subcellular distribution of endogenous HO-1 was determined with immunofluorescence staining in HK1 cells stimulated with RT (scale bars: 10 μm). (J) Nuclear and cytoplasmic protein extraction experiment was performed to determine the cellular localization of endogenous HO-1 at the indicated time point of RT in HK1 cells. (K and L) HMOX1-KO HK1 cells were stably transfected with the indicated HO-1 mutants. With or without RT, cGAMP (K) and IFN-β (L) production was determined with ELISA. (M and N) HMOX1-KO HK1 cells were stably transfected with indicated HO-1 mutants. With or without cGAMP, STING activation was determined with immunoblot analysis (M), and IFN-β production was determined by ELISA (N). Representative data from 1 experiment are shown (n = 3 biologically independent experiments). *P < 0.05, **P < 0.01, ***P < 0.001, and ****P < 0.0001, by 1-way ANOVA (K, L, and N). Data are shown as the mean ± SD.

