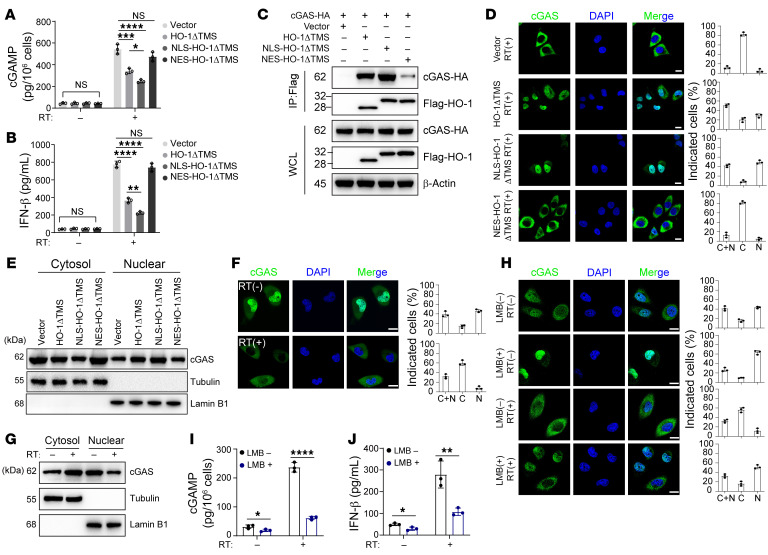
Figure 5. Cleaved HO-1 inhibits the nuclear export of cGAS.
(A–E) HMOX1-KO HK1 cells were stably transfected with cleaved HO-1 (HO-1ΔTMS), exclusively nucleus-located cleaved HO-1 (NLS-HO-1ΔTMS), or exclusively cytoplasm-located cleaved HO-1 (NES-HO-1ΔTMS) individually. (A and B) ELISA of cGAMP (A) or IFN-β (B) production before and after RT. (C) The interaction of Flag-tagged HO-1 mutants and HA-tagged cGAS in HEK293T cells was analyzed by immunoprecipitation under RT. WCL, whole-cell lysate. (D, F, and H) Subcellular distribution (cytoplasm and nucleus) of cGAS was determined by immunofluorescence staining of HK1 cells with the indicated mutants or RT stimulation (scale bars: 10 μm). The percentages of cells (n = 200) in the nucleus, cytoplasm, or both the cytoplasm and nucleus were calculated. (E and G) The cytoplasmic and nuclear protein fractions were extracted for immunoblot analysis to determine the subcellular localization of cGAS in HK1 cells with the indicated mutants or RT stimulation. (I and J) ELISA of cGAMP (I) or IFN-β (J) production before and after RT (related to Figure 5H). Data are shown as the mean ± SD. *P < 0.05, **P < 0.01, ***P < 0.001, and ****P < 0.0001, by 1-way ANOVA (A and B) and unpaired, 2-tailed Student’s t test (I and J). All representative data from 1 experiment are shown (n = 3 biologically independent experiments). N, predominantly in the nucleus; C, predominately in the cytoplasm; C+N, evenly distributed in the nucleus and cytoplasm.

