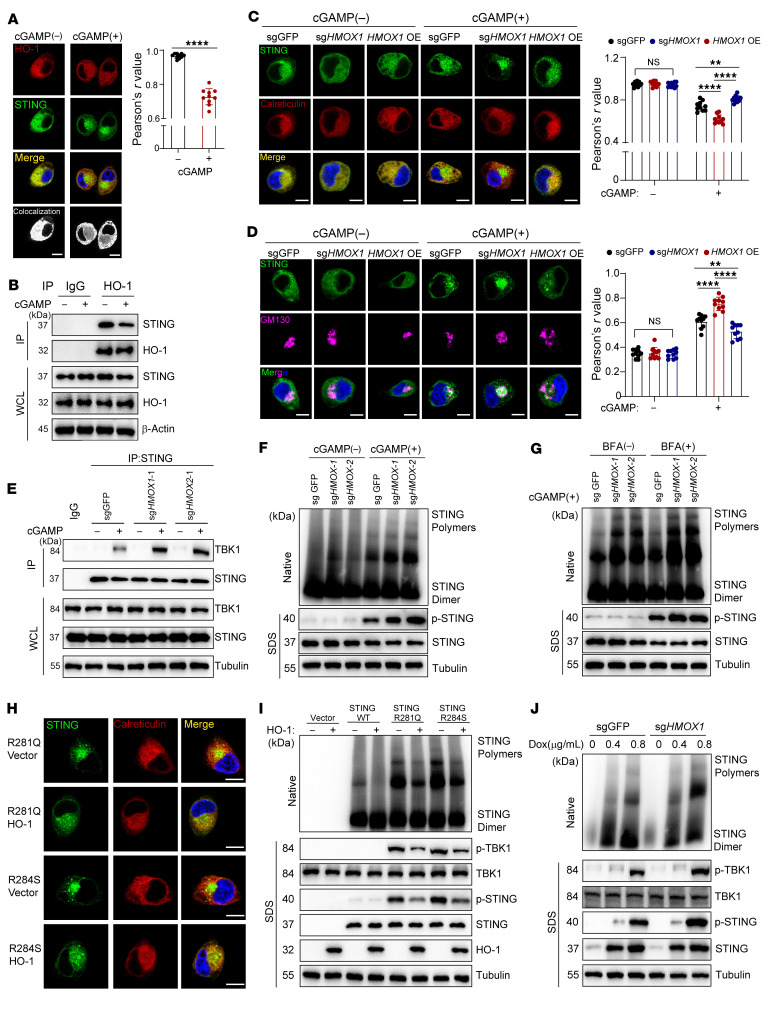
Figure 7. HO-1 inhibits STING oligomerization and consecutive ER-to-Golgi translocation by direct interaction.
(A) Confocal microscopy images of STING and HO-1 in HK1 cells with the indicated treatment. Pearson’s r value was used as a statistical measure to determine the extent of colocalization between HO-1 and STING. (B) The interaction of endogenous HO-1 and STING in HK1 cells was analyzed by immunoprecipitation with the indicated treatment. (C and D) Control, HMOX1-KO, and HMOX1-overexpressing HK1 cells were stained with anti-STING (C and D), anti-calreticulin (C), and anti-GM130 (D) antibodies. Pearson’s r value was used as a statistical measure to determine the extent of colocalization between STING and calreticulin or GM130. (E) The interaction of endogenous STING and TBK1 in HK1 cells was analyzed by immunoprecipitation with the indicated treatment. (F and G) STING polymerization in control and HMOX1-KO HK1 cells with the indicated treatments, followed by native PAGE and SDS-PAGE. (H) HEK293T cells were transfected with the indicated STING mutant plus vector or STING mutant plus HO-1, followed by confocal imaging. (I) HEK293T cells were cotransfected with plasmids expressing HO-1 and STING, or its mutants, followed by native PAGE and SDS-PAGE. (J) HK1 cells were stably transfected with doxycycline-induced (Dox) STING expression plasmids. After doxycycline treatment at the indicated dose, native PAGE for detection of STING polymers and SDS-PAGE were performed. (A) Imaging data were analyzed with Fuji software to reveal colocalization as white dots. (A, C, and D) Pearson’s correlation coefficient was quantified using ImageJ (NIH). n = 10 cells (quantified in a blinded manner). Data are shown as the mean ± SD. Scale bars: 10 μm. **P < 0.01 and ****P < 0.0001 by unpaired, 2-tailed Student’s t test (A) and 1-way ANOVA (C and D).

