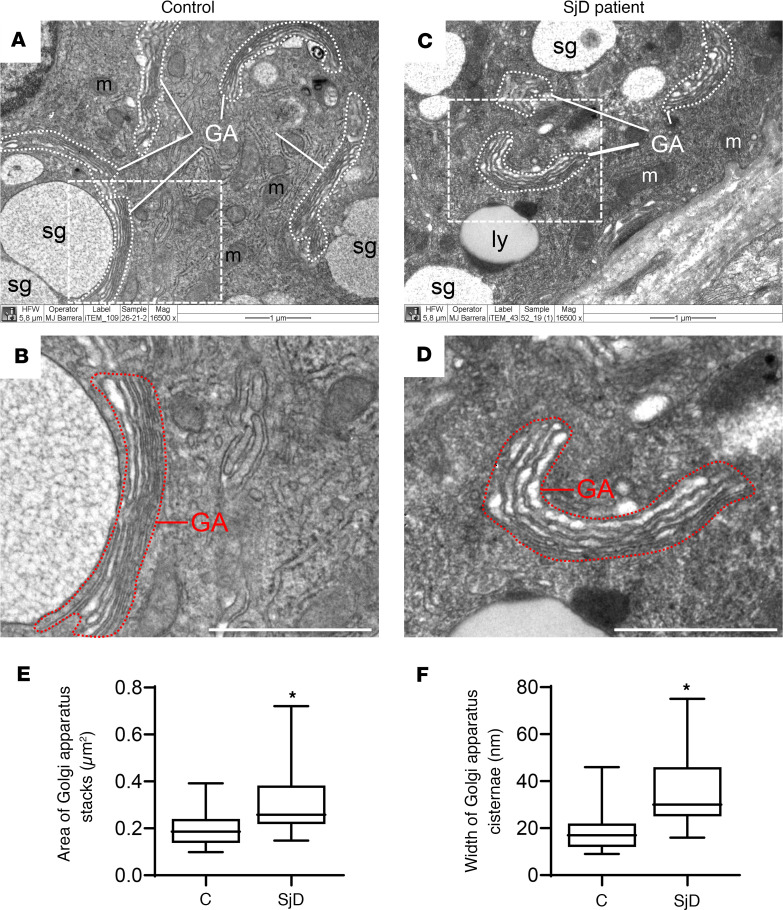
Figure 1. Swelling of the Golgi apparatus cisterns in epithelial cells of LSGs from patients with SjD.
(A–D) Representative transmission electron micrographs showing the Golgi apparatus (GA) stacks surrounded by white dashed lines in salivary epithelial cells of an individual acting as a control and a patient with SjD. Scale bars: 1 μm. m, mitochondria; sg, secretory granule; ly, lysosome. (B and D) Higher-magnification images of regions bound by dashed lines in A and C, showing the GA stacks bound by red dashed lines. (E and F) Box plots showing the area of the Golgi apparatus stacks and the width of the Golgi apparatus cisternae. The quantification was performed on ultrathin sections from 3 individuals acting as controls and 6 patients with SjD. Boxes represent the 25th–75th percentiles; the lines within the boxes represent the median; and the whiskers represent the minimum and maximum. *P < 0.05 was considered significant using the Mann-Whitney test.

