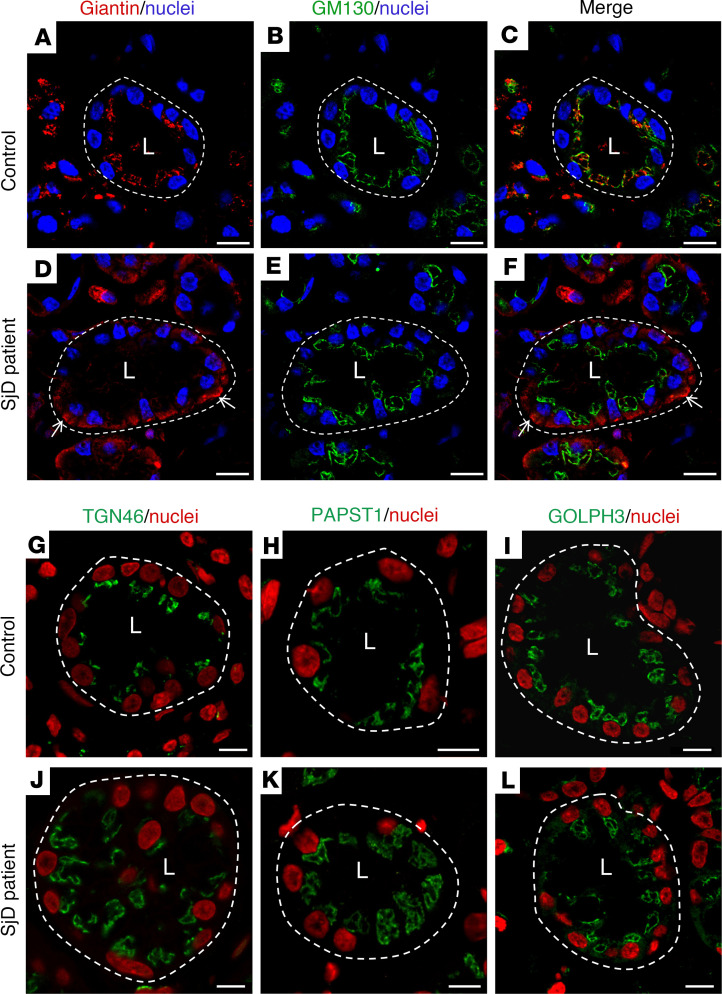
Figure 2. Altered localization of Giantin in LSGs from patients with SjD.
(A–F) Representative micrographs of double staining of Giantin (red) and GM130 (green) in a section of LSG from an individual acting as a control (A–C) and a patient with SjD (D–F). White arrows show Giantin staining in the basolateral region. (G–L) Representative images of TGN46, PAPST1, and GOLPH3 in LSG sections from individuals acting as controls (G–I) and patients with SjD (J–L). Hoechst 33342 was used for nuclear staining. The white dashed lines indicate acinar boundaries. L, lumen. Scale bars: 20 μm (A–F); 10 μm (G–L).

