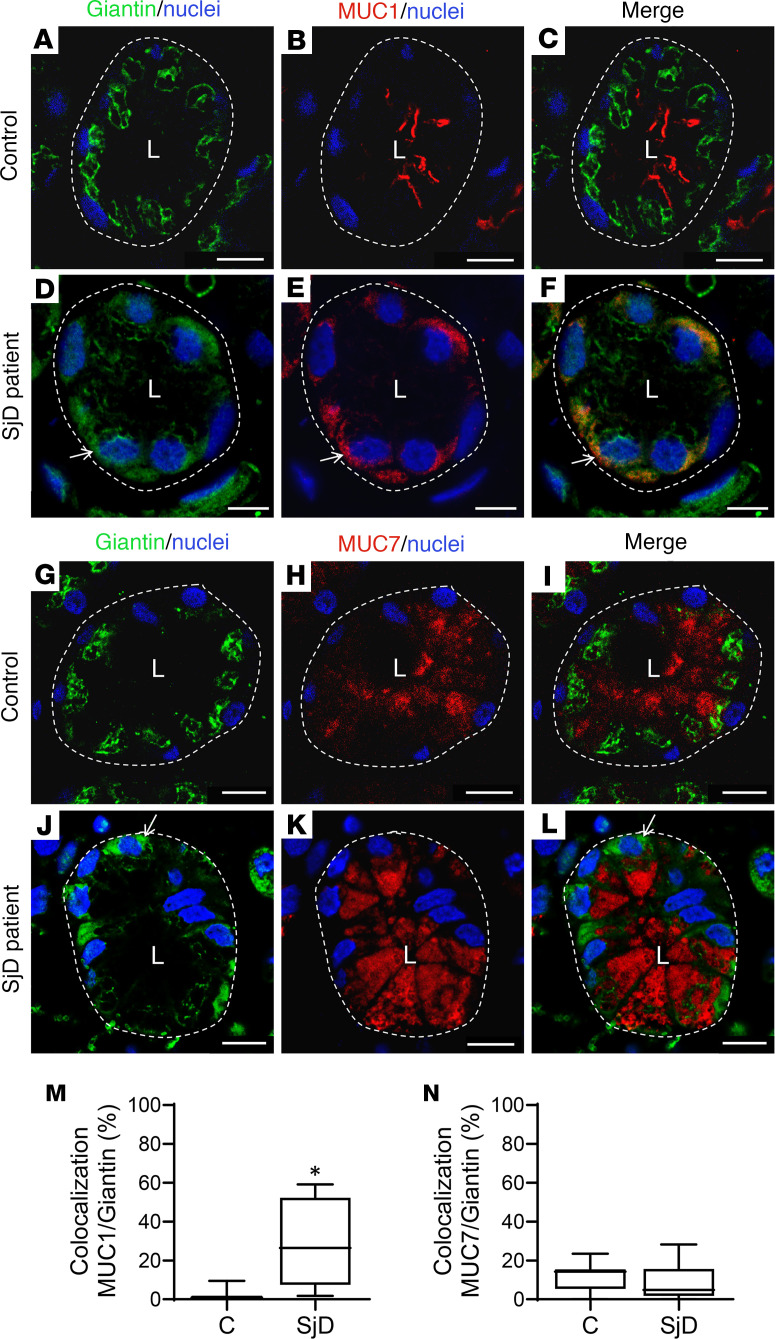
Figure 4. Altered localization of Giantin and mucins in LSGs from patients with SjD.
(A–F) Representative micrographs of double staining of Giantin (green) and MUC1 (red) in a section of LSG from an individual acting as a control (A–C) and a patient with SjD (D–F). (G–I) Representative micrographs of double staining of Giantin (green) and MUC7 (red) in a section of LSG from an individual acting as a control (G–I) and patient with SjD (J–I). Hoechst 33342 (blue) was used for nuclear staining. The dashed lines indicate acinar boundaries. L, lumen. Scale bars: 10 μm. (M and N) Colocalization analysis of Giantin and mucins in acini from LSG sections of 5 individuals acting as controls and 5 patients with SjD. Boxes represent the 25th–75th percentiles; the lines within the boxes represent the median; and the whiskers represent the minimum and maximum. *P < 0.05 was considered significant using the Mann-Whitney test.

