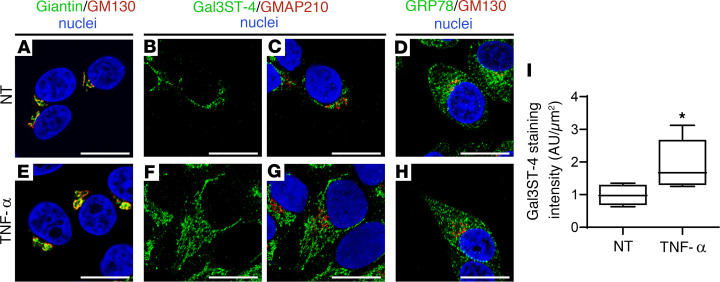
Figure 8. Altered Gal3ST-4 localization in TNF-α–stimulated HSG cells.
Representative micrographs of (A–D) nontreated (NT) HSG cells or (E–H) HSG cells stimulated with 10 ng/mL TNF-α for 24 hours. (A and E) The merged RGB channels of the double staining of Giantin (green) and GM130 (red). (B and F) The green channel of the double staining of Gal3ST-4 (green) and GMAP210 (red). (C and G) The merged RGB channels. (D and H) The merged RGB channels of the double staining of GRP78 (green) and GM130 (red). Hoechst 33342 (blue) was used for nuclear staining. Scale bars: 10 μm. (I) Box plot showing the quantification of Gal3ST-4 staining. Boxes represent the 25th–75th percentiles; the lines within the boxes represent the median; and the whiskers represent the minimum and maximum. *P < 0.05 was considered significant using the Mann-Whitney test.

