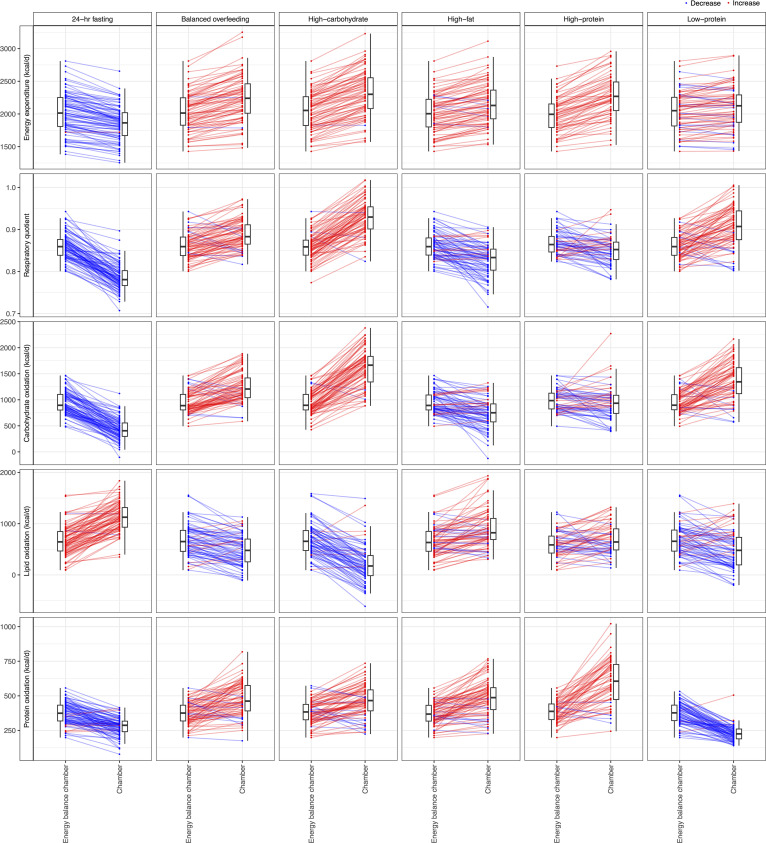
Figure 2. Heterogeneity in metabolic responses to dietary perturbation.
Here, we present changes in 5 metabolic parameters (rows) from all dietary chambers, with comparison to the energy balance chamber. Bars represent the mean change across all participants, and points represent individual participants. While most participants followed the average trend, some individuals displayed opposing changes (e.g., in the high-fat chamber, the average change in respiratory quotient was a decrease; however, in some participants, the respiratory quotient increased). Red indicates that the average effect was an increase in the metabolic parameter during the dietary chamber compared with energy balance; blue indicates a decrease.

