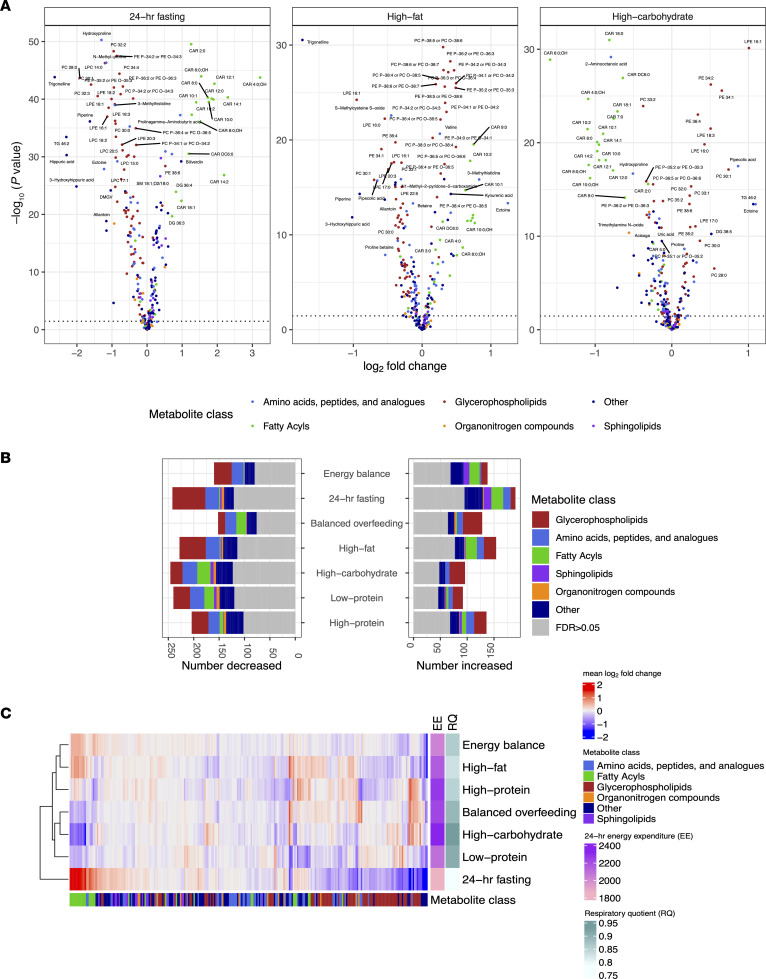
Figure 3. Metabolic responses to dietary intervention.
(A) Volcano plots of paired t tests comparing postchamber metabolite levels with prechamber metabolite levels for select chambers. Results for all chambers are presented in Supplemental Figure 2. (B) Results from paired t tests are summarized for each dietary chamber, grouped by HMDB metabolite class demonstrating glycerophospholipids as the most common class of metabolite to change. (C) Heatmap of the mean log2 fold change for all metabolites for all dietary chambers, demonstrating similarities between clusters of diets.

