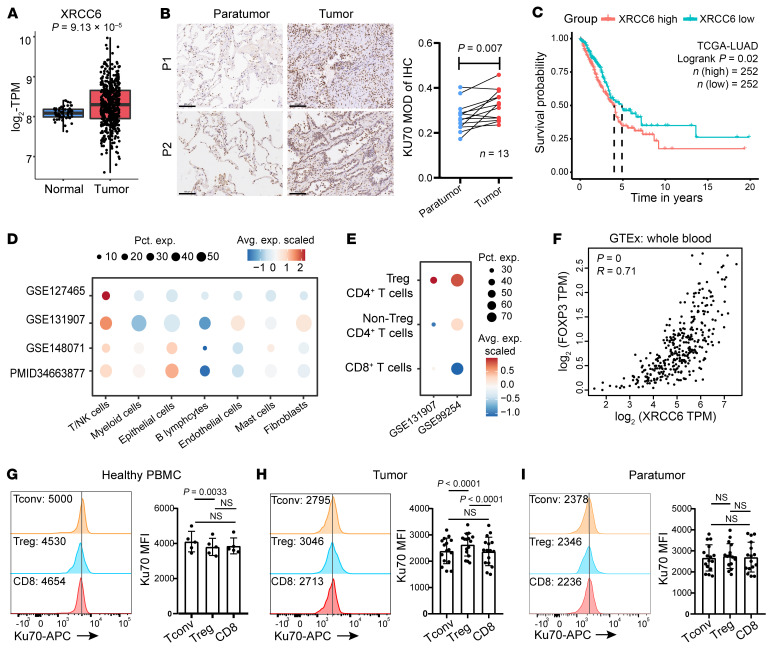
Figure 1. Increased Ku70 expression indicates an adverse prognosis in LUAD, particularly enhanced in tumor-infiltrating Tregs.
(A) The expression of XRCC6 between normal (n = 58) and LUAD tissues (n = 513) from the TCGA database. (B) Immunohistochemical analysis of Ku70 expression in tissues from LUAD patients (n = 13). Scale bar: 100 μm. (C) Overall survival analysis based on XRCC6 gene expression (median) using Kaplan–Meier curves in the TCGA-LUAD cohort. The red line represents patients with high XRCC6 expression, while the blue line represents those with low expression. P values were calculated using log-rank test. (D and E) Dot plot depicting XRCC6 expression in different cell clusters. The dot size reflected the percentage of cells in a cluster expressing each gene. The dot color reflected the expression level. (F) Correlation between FOXP3 expression and XRCC6 expression in whole blood from GTEx database. Spearman’s correlation was used for calculation. (G–I) Quantification of Ku70 expression in PBMCs from healthy donors (n = 5; G), tumor tissues (H), and paratumor tissues (I) from LUAD patients (n = 16). Statistical analyses were performed using Student’s paired t test between Tregs and Tconv cells from donors and Tregs and CD8+ cells as well as between CD8+ and Tconv cells. Data are represented as means ± SD.

