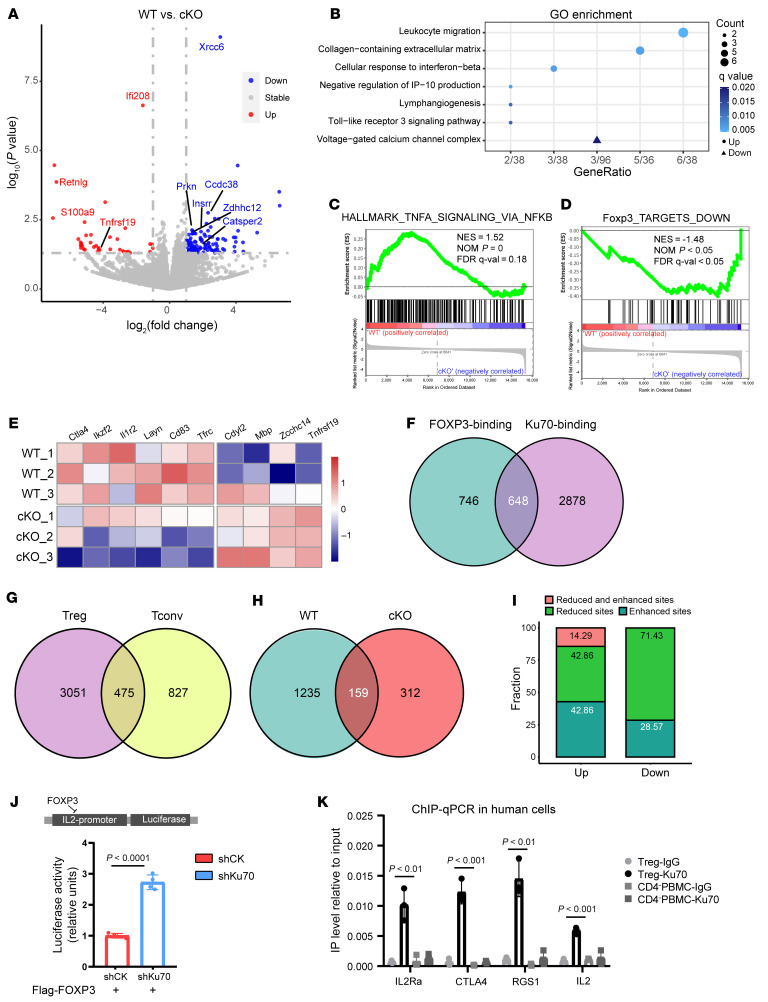
Figure 7. Ku70 enhances the functionality of FOXP3 transcription.
(A) Volcano plot generated from RNA-Seq differential expression analysis using tumor-infiltrating Tregs. Tregs were isolated from LLC tumor-bearing WT or cKO mice at 21 days after tumor injection. Compared with the WT group, blue represents decrease in the cKO group, and red represents increase. The horizontal line denotes the significance threshold (P < 0.05) for DEGs. The vertical line denotes the log2(foldchange) threshold of 1. (B) Gene Ontology analysis of enriched pathways of upregulated genes (circle) or downregulated genes (triangle) in RNA-Seq. (C and D) GSEA enrichment plots of the indicated signatures in tumor-infiltrating WT and Ku70-deficient Tregs. (E) Heatmap showing expression of selected FOXP3-associated genes. (F) Venn diagram of FOXP3 ChIP-Seq peaks and Ku70 ChIP-Seq peaks in Tregs from FOXP3Cre mice. (G) Venn diagram of Ku70 ChIP-Seq peaks in Tregs and Tconv cells from Foxp3Cre mice. (H) Venn diagram of FOXP3 ChIP-Seq peaks in Tregs from FOXP3Cre and FOXP3CreXRCC6fl/fl mice. (I) The bar graph illustrates the changes in FOXP3 binding for the differentially expressed genes that harbor altered FOXP3 binding sites. (J) HEK293T cells were cotransfected with either IL-2 promoter luciferase reporter and FOXP3-overexpressing plasmid, control vector, or shKu70 vector. Data were normalized to Renilla luciferase activity; the average induction in control group was set at 100%. (K) Anti-Ku70 or control rabbit Ig was used to precipitate crosslinked protein–DNA complexes from human iTreg lysates of CD4-negative (CD4–) PBMC lysates. The crosslinking of the immunoprecipitated material was removed and protease treated, and the DNA was purified. Ku70 IP versus the IgG fold enrichment ratio was determined from duplicate ChIP assay evaluated in duplicate by qRT-PCR. Data were normalized to input chromatin (normalized for nonspecific chromatin IP). P value was calculated between iTreg-Ku70 and CD4– PBMCs. Data are represented as the mean ± SD. Significance was measured by unpaired 2-tailed Student’s t test.

