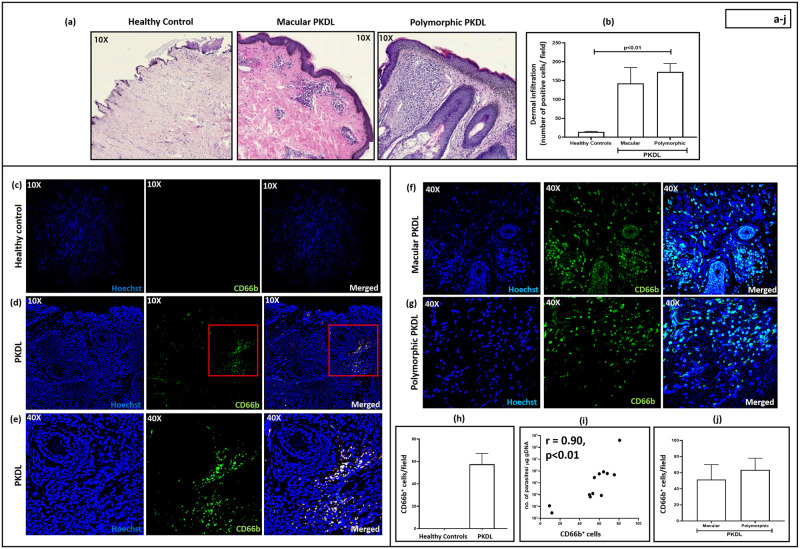
Fig 1. Status of lesional CD66b+ neutrophils in patients with Post Kala-azar Dermal Leishmaniasis (PKDL).
(a): Representative profiles of H&E stained sections from dermal biopsies of a healthy individual (n = 6), patient with macular (n = 6) and polymorphic PKDL (n = 6, 10X magnification). (b) Bar graphs indicating the total dermal infiltration in healthy controls (n = 6), macular (n = 6) or polymorphic (n = 6) PKDL. Each horizontal bar represents the median (IQR). (c): Representative immunofluorescence profiles of CD66b+ cells from dermal biopsies of a healthy individual (10X magnification), stained with CD66b (green) and Hoechst (blue). (d-e): Representative immunofluorescence profiles of CD66b+ cells from dermal biopsies of a patient with PKDL at 10X (d) and 40X magnification (e), stained with CD66b (green) and Hoechst (blue). The red squares in 10X images (d) represent the area that was imaged at 40X magnification (e). (f-g): Representative immunofluorescence profiles of CD66b+ cells from dermal biopsies of a patient with macular (f) and polymorphic PKDL (g) at 40X magnification, stained with CD66b (green) and Hoechst (blue). (h): Bar graphs indicating the neutrophil infiltration in healthy controls (n = 6) and patients with PKDL (n = 12). Each horizontal bar represents the median (IQR). (i): Correlation of neutrophil infiltration (counts/field) with parasite load (no. of parasites/μg genomic DNA. (j): Bar graphs indicating the neutrophil infiltration in patients with macular (n = 6) and polymorphic PKDL (n = 6). Each horizontal bar represents the median (IQR).

