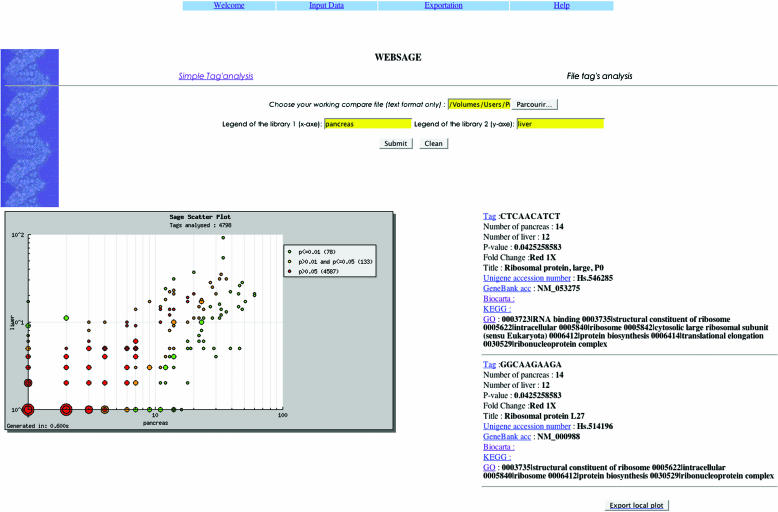
Figure 1.
An example of WEBSAGE analysis of differently expressed tags. A total of 4809 tags from pancreatic cancer lines and an isogenic liver metastasis cell line were analysed. A scatter plot is automatically computed from the file to visualize the results. Each plot corresponds to one tag or a set of tags, having the same P-value and the same apparition on the two libraries. The size of the plot is proportional to the number of tags contained within it. Once clicked, a web page is displayed with a list of tags and their identification. The identification consists of the name of the tag and the corresponding gene, the P-value and the Unigene and GenBank accession number.

