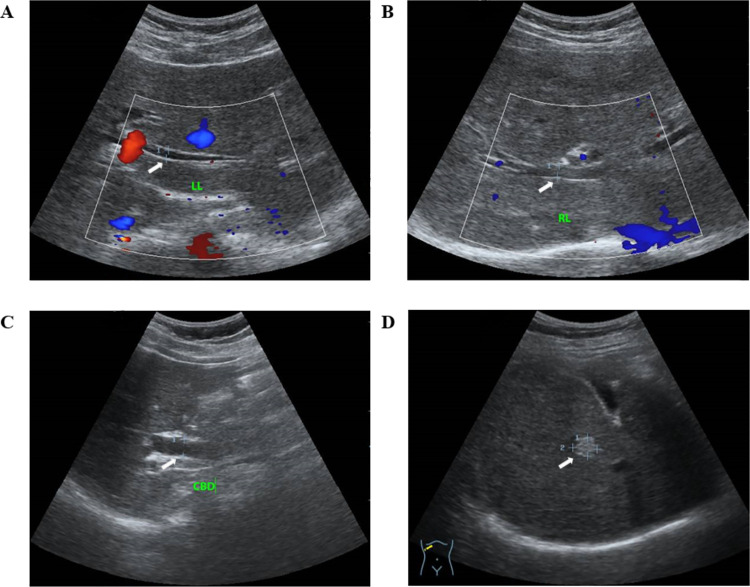
Fig 2. Ultrasound images for bile duct dilatation and liver masses.
These ultrasound images, obtained from two different study participants (A-C from a 60-year-old male and D from a 63-year-old male), were classified into four categories for suspected CCA diagnosis: (A) left liver lobe (LL) dilatation (3.7 mm), (B) right liver lobe (RL) dilatation (4.8 mm), (C) common bile duct (CBD) dilatation (9.9 mm), and (D) a single hyperechoic liver mass with an ill-defined margin (9.3*11.9 mm). White arrows indicate areas of pathology, while red areas in A indicate blood flow toward the probe, and blue areas in A and B indicate blood flow away from the probe.

