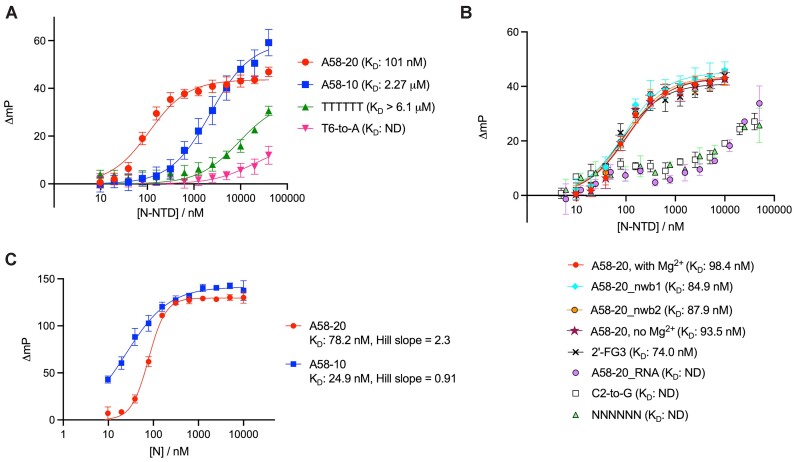
Figure 2.
Fluorescence anisotropy analyses of aptamer binding to N-NTD or full-length N protein. (A, B) Binding of A58-20 DNA or its variants, including those designed based on the structural information presented below (Figure 4), to N-NTD. (C) Binding of A58-20 and A58-10 DNA to full-length N protein. Changes in fluorescence polarization (mP) from the control sample containing no protein were plotted against the total protein concentration in the reaction. ND, not determined. Schematics of the DNA aptamers are shown in Figure 3A. Data points are the mean ± standard deviation of at least six (A) or three (B, C) technical replicates. All oligonucleotides used in the experiments shown in this figure were fluorescently labeled on the 3′ end. The KD values determined using the FA assay are summarized in Supplementary Table S1.

