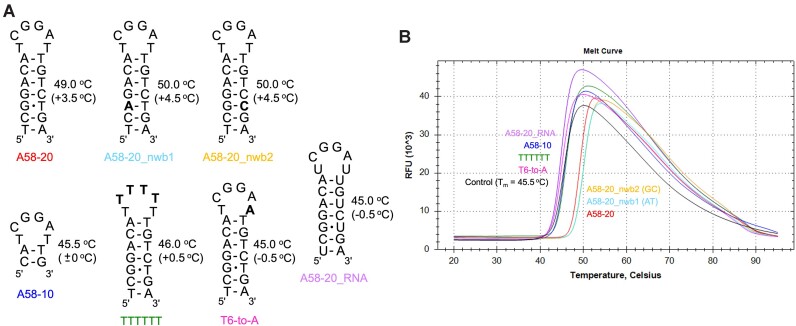
Figure 3.
DSF analyses of the stabilizing effect of DNA/RNA aptamers on N-NTD. (A) Schematics of various stem-loop aptamers. Sequence modifications from the parental A58-20 are highlighted in bold. For each aptamer, the Tm value of N-NTD in its presence is shown on the right (the shift of Tm from that for N-NTD alone is shown in parenthesis). (B) Melt curves of N-NTD in the presence of indicated aptamers. The control sample (black trace) contained no aptamer. Identical Tm values were obtained in duplicate experiments, from which one melt curve for each sample is shown.

