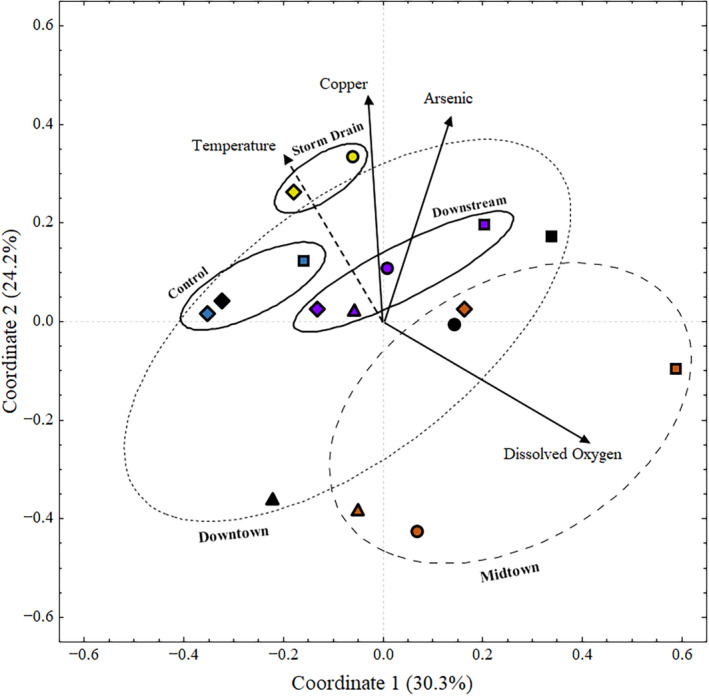
FIGURE 6.

Principal coordinates analysis ordination calculated using the Jaccard dissimilarity matrix of the occurrence of copper‐related genes in 16 metagenomes from Silver Bow Creek and Blacktail Creek. Significantly correlated geochemical parameters are fit to the ordination using the ‘envfit’ function in R. Points represent the copper resistome of each discrete metagenome. Vectors represent geochemical variables. Significantly correlated (p ≤0.05) parameters are represented with a black line. Parameters that approach significance (p ≤0.1) are represented using a dotted line. Colours indicate a site (blue = Control, yellow = Storm Drain, orange = Midtown, black = Downtown, purple = Downstream). Shapes indicate season (triangle = February, square = May, diamond = August, circle = November). Closely related resistomes (Control, Storm Drain, Downstream) from the same site are grouped using black circles. More variable resistomes from the same site are grouped using dashed circles (Downtown, Midtown).
