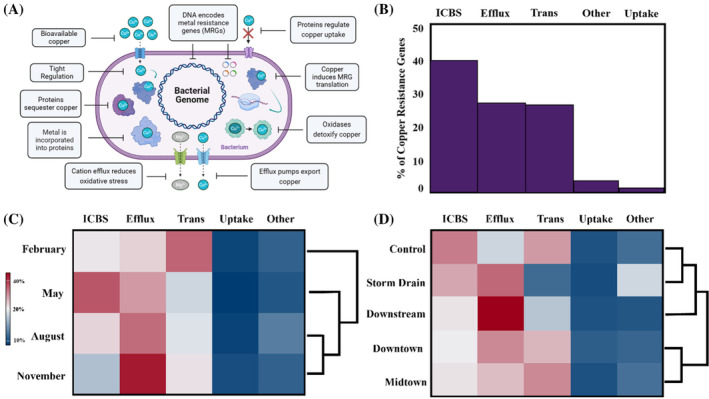
FIGURE 8.

(A) Copper resistance gene functional groups used by bacteria to reduce copper stress. (B) Copper resistance gene functional category relative abundances in all metagenomes (Efflux, cation efflux; ICBS, intercellular binding and signalling; Trans, transformation). (C) Copper resistance gene functional category relative abundances arranged by month. (D) Copper resistance gene functional category relative abundances arranged by site. Red colours indicate high abundances (>20% of the resistome), white colours indicate medium abundances (~20% of the resistome) and blue colours indicate low abundances (<20%) of the resistome. The colour strength is proportional to higher divergence from the mean. Hierarchical clustering dendrogram linkages are calculated using Ward's method and represent similarities between the resistomes.
