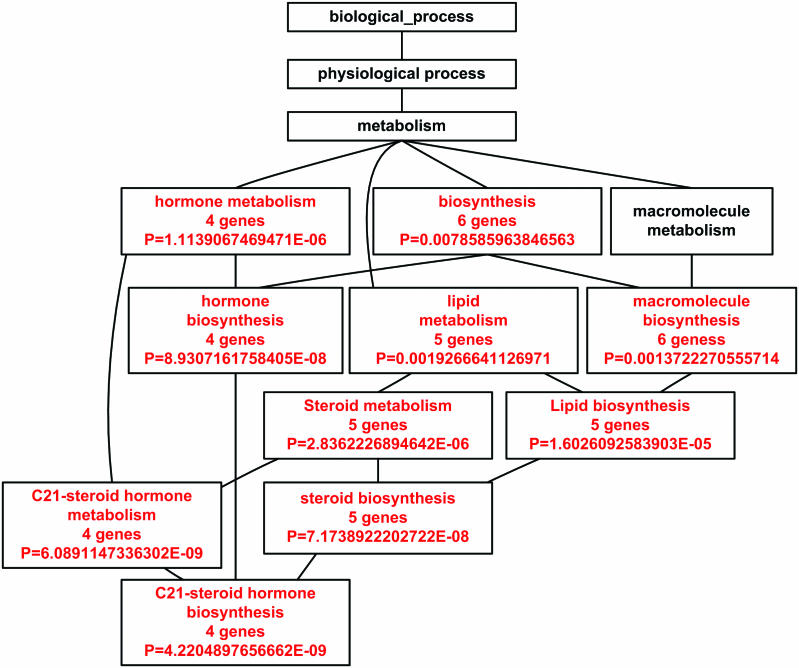
Figure 2.
Enriched DAG under ‘biological process’ for a set of 23 genes that are significantly over-represented in adrenal cortex, using all genes in the human genome as a reference. The enriched GO categories are brought together and visualized as a DAG. Categories in red are enriched ones while those in black are non-enriched parents. Listed in the boxes are the name of the GO category, the number of genes in the category and the P-value indicating the significance of enrichment.

